
- Startseite >
- Flüsse >
- Wasserstand >
- Naab - Regen >
- Schwandorf >
- Jahresgrafik

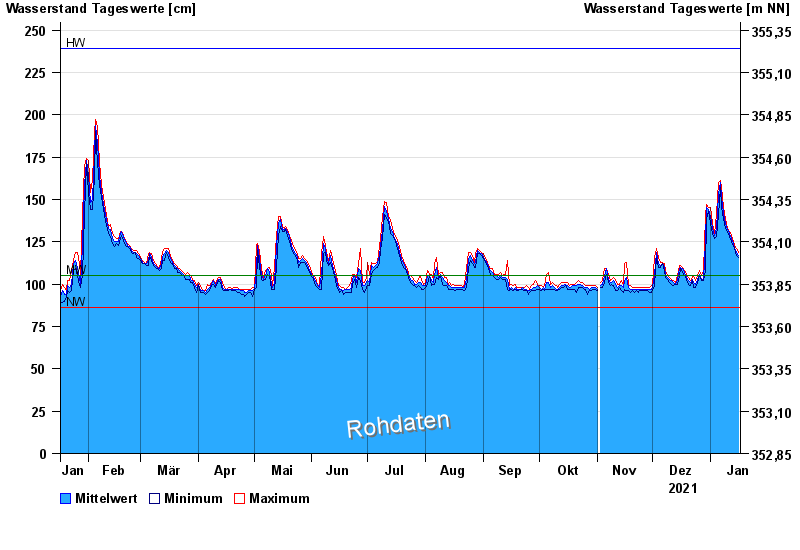
Jahresgrafik Schwandorf / Naab
Wasserstand vom 17.01.2021 bis zum 16.01.2022
Hinweis
Pegel bis auf Weiteres außer Betrieb wegen Brückenbauarbeiten.
| Datum | Mittelwert [cm] | Maximum [cm] | Minimum [cm] |
|---|---|---|---|
| 16.01.2022 | 117 | 119 | 116 |
| 15.01.2022 | 119 | 121 | 117 |
| 14.01.2022 | 121 | 123 | 121 |
| 13.01.2022 | 124 | 125 | 122 |
| 12.01.2022 | 127 | 129 | 125 |
| 11.01.2022 | 130 | 131 | 128 |
| 10.01.2022 | 132 | 133 | 131 |
© Bayerisches Landesamt für Umwelt 2024