
- Startseite >
- Flüsse >
- Wasserstand >
- Naab - Regen >
- Schwandorf >
- Jahresgrafik

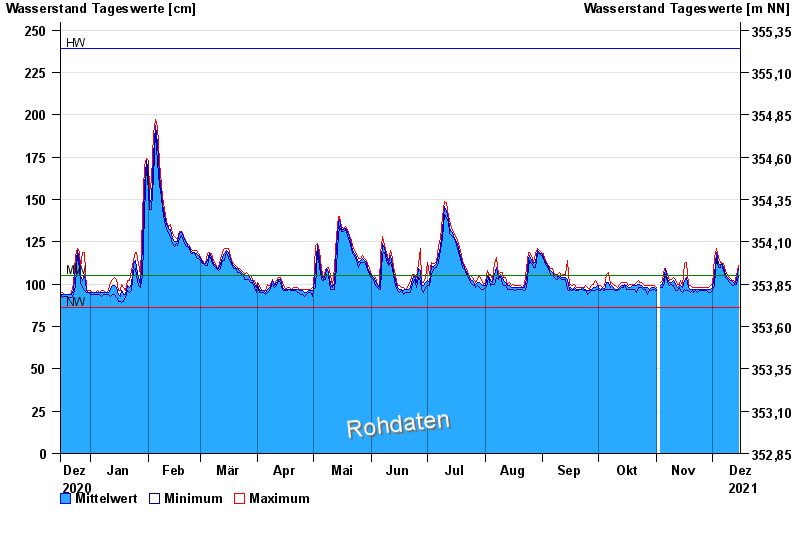
Jahresgrafik Schwandorf / Naab
Wasserstand vom 16.12.2020 bis zum 15.12.2021
Hinweis
Pegel bis auf Weiteres außer Betrieb wegen Brückenbauarbeiten.
| Datum | Mittelwert [cm] | Maximum [cm] | Minimum [cm] |
|---|---|---|---|
| 15.12.2021 | 109 | 111 | 105 |
| 14.12.2021 | 102 | 105 | 100 |
| 13.12.2021 | 100 | 101 | 100 |
| 12.12.2021 | 101 | 102 | 99 |
| 11.12.2021 | 102 | 103 | 100 |
| 10.12.2021 | 103 | 104 | 101 |
| 09.12.2021 | 104 | 105 | 103 |
© Bayerisches Landesamt für Umwelt 2024