
- Startseite >
- Flüsse >
- Wasserstand >
- Naab - Regen >
- Schwabelweis >
- Jahresgrafik

Jahresgrafik Schwabelweis / Donau
Wasserstand vom 19.05.2021 bis zum 18.05.2022
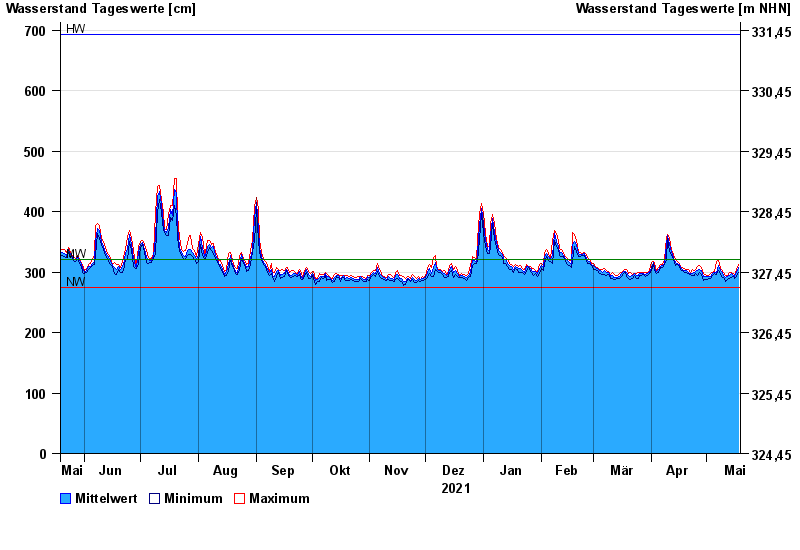
| Datum | Mittelwert [cm] | Maximum [cm] | Minimum [cm] |
|---|---|---|---|
| 18.05.2022 | 307 | 313 | 300 |
| 17.05.2022 | 300 | 305 | 293 |
| 16.05.2022 | 293 | 295 | 290 |
| 15.05.2022 | 295 | 298 | 293 |
| 14.05.2022 | 297 | 300 | 291 |
| 13.05.2022 | 295 | 300 | 289 |
| 12.05.2022 | 292 | 295 | 288 |
© Bayerisches Landesamt für Umwelt 2024