
- Startseite >
- Flüsse >
- Wasserstand >
- Naab - Regen >
- Schwabelweis >
- Jahresgrafik

Jahresgrafik Schwabelweis / Donau
Wasserstand vom 16.07.2021 bis zum 15.07.2022
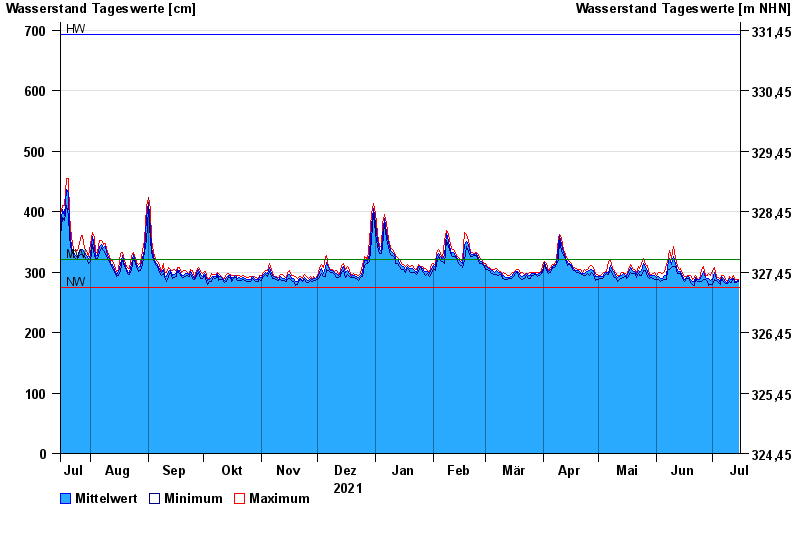
| Datum | Mittelwert [cm] | Maximum [cm] | Minimum [cm] |
|---|---|---|---|
| 15.07.2022 | 286 | 288 | 284 |
| 14.07.2022 | 285 | 288 | 283 |
| 13.07.2022 | 286 | 289 | 283 |
| 12.07.2022 | 290 | 294 | 289 |
| 11.07.2022 | 287 | 290 | 282 |
| 10.07.2022 | 290 | 293 | 285 |
| 09.07.2022 | 282 | 285 | 281 |
© Bayerisches Landesamt für Umwelt 2024