
- Startseite >
- Flüsse >
- Wasserstand >
- Naab - Regen >
- Schmidmühlen >
- Jahresgrafik

Jahresgrafik Schmidmühlen / Vils
Wasserstand vom 27.02.2020 bis zum 26.02.2021
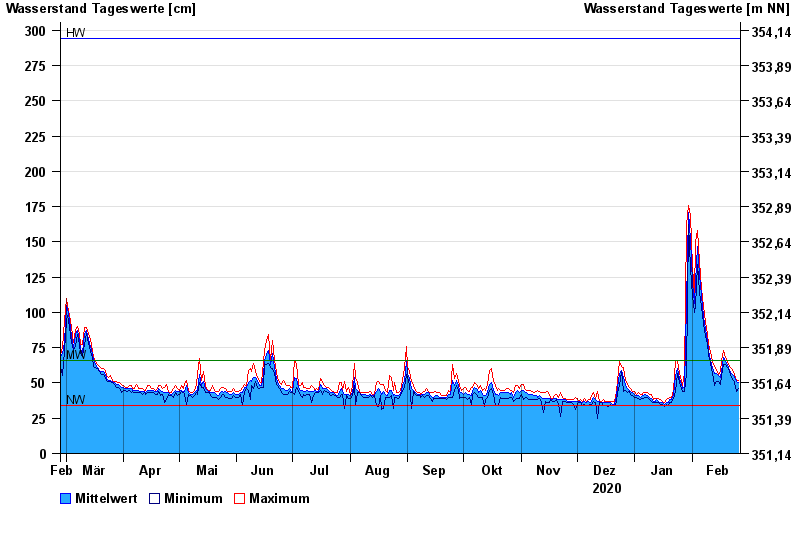
| Datum | Mittelwert [cm] | Maximum [cm] | Minimum [cm] |
|---|---|---|---|
| 26.02.2021 | 50 | 52 | 46 |
| 25.02.2021 | 51 | 52 | 44 |
| 24.02.2021 | 54 | 56 | 50 |
| 23.02.2021 | 55 | 58 | 52 |
| 22.02.2021 | 57 | 60 | 54 |
| 21.02.2021 | 59 | 62 | 58 |
| 20.02.2021 | 63 | 65 | 61 |
© Bayerisches Landesamt für Umwelt 2024