
- Startseite >
- Flüsse >
- Wasserstand >
- Naab - Regen >
- Pulling >
- Monatsgrafik

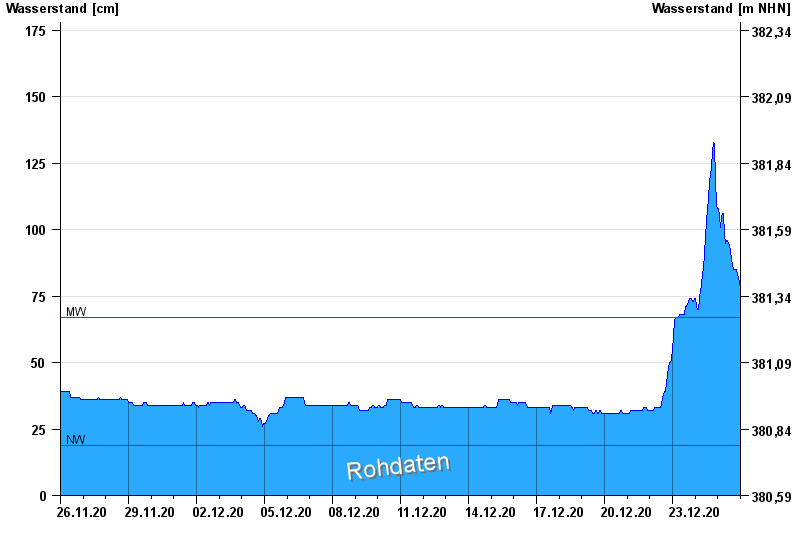
Monatsgrafik Pulling / Regen
Wasserstand vom 26.11.2020 bis zum 25.12.2020
| Datum | Wasserstand [cm] |
|---|---|
| 25.12.2020 23:45 | 77 |
| 25.12.2020 23:30 | 78 |
| 25.12.2020 23:15 | 79 |
| 25.12.2020 23:00 | 80 |
| 25.12.2020 22:45 | 80 |
| 25.12.2020 22:30 | 80 |
| 25.12.2020 22:15 | 81 |
© Bayerisches Landesamt für Umwelt 2024