
- Startseite >
- Flüsse >
- Wasserstand >
- Naab - Regen >
- Pulling >
- Monatsgrafik

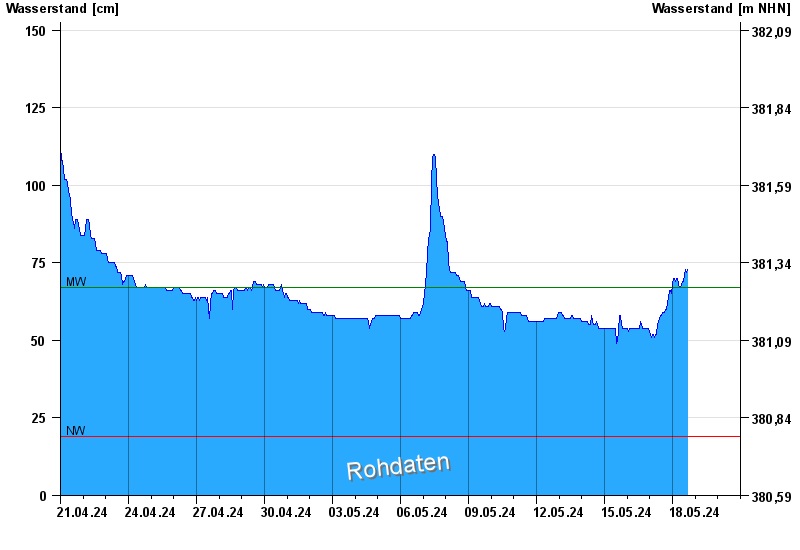
Monatsgrafik Pulling / Regen
Wasserstand vom 21.04.2024 bis zum 20.05.2024
| Datum | Wasserstand [cm] |
|---|---|
| 19.05.2024 03:45 | 68 |
| 19.05.2024 03:30 | 68 |
| 19.05.2024 03:15 | 68 |
| 19.05.2024 03:00 | 68 |
| 19.05.2024 02:45 | 68 |
| 19.05.2024 02:30 | 68 |
| 19.05.2024 02:15 | 69 |
© Bayerisches Landesamt für Umwelt 2024