
- Startseite >
- Flüsse >
- Wasserstand >
- Naab - Regen >
- Pulling >
- Jahresgrafik

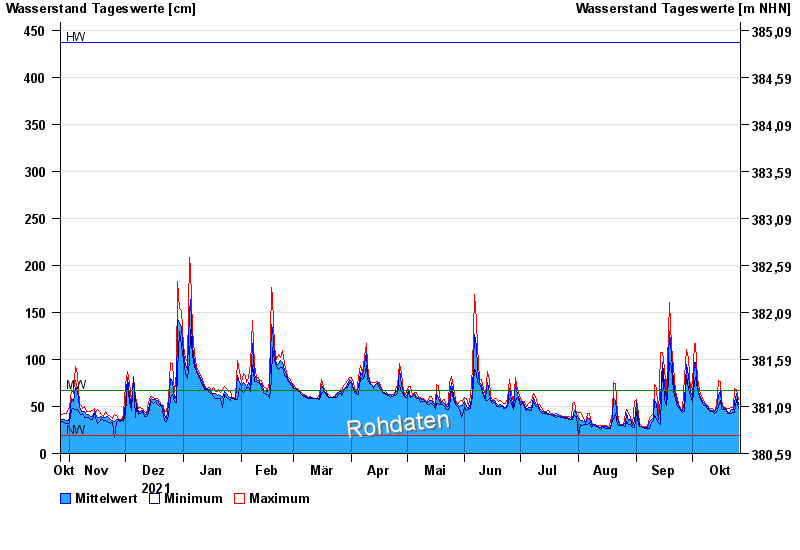
Jahresgrafik Pulling / Regen
Wasserstand vom 27.10.2021 bis zum 26.10.2022
| Datum | Mittelwert [cm] | Maximum [cm] | Minimum [cm] |
|---|---|---|---|
| 26.10.2022 | 52 | 57 | 48 |
| 25.10.2022 | 64 | 68 | 57 |
| 24.10.2022 | 54 | 69 | 44 |
| 23.10.2022 | 47 | 49 | 44 |
| 22.10.2022 | 47 | 49 | 43 |
| 21.10.2022 | 44 | 48 | 43 |
| 20.10.2022 | 45 | 48 | 43 |
© Bayerisches Landesamt für Umwelt 2024