
- Startseite >
- Flüsse >
- Wasserstand >
- Naab - Regen >
- Pulling >
- Jahresgrafik

Jahresgrafik Pulling / Regen
Wasserstand vom 21.01.2022 bis zum 20.01.2023
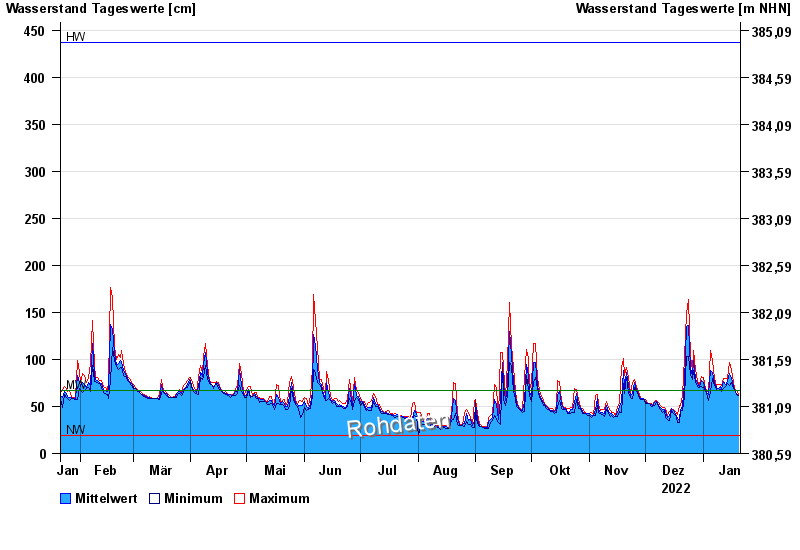
| Datum | Mittelwert [cm] | Maximum [cm] | Minimum [cm] |
|---|---|---|---|
| 20.01.2023 | 62 | 63 | 62 |
| 19.01.2023 | 64 | 67 | 63 |
| 18.01.2023 | 67 | 69 | 67 |
| 17.01.2023 | 72 | 75 | 69 |
| 16.01.2023 | 80 | 89 | 75 |
| 15.01.2023 | 85 | 97 | 72 |
| 14.01.2023 | 77 | 80 | 74 |
© Bayerisches Landesamt für Umwelt 2024