
- Startseite >
- Flüsse >
- Wasserstand >
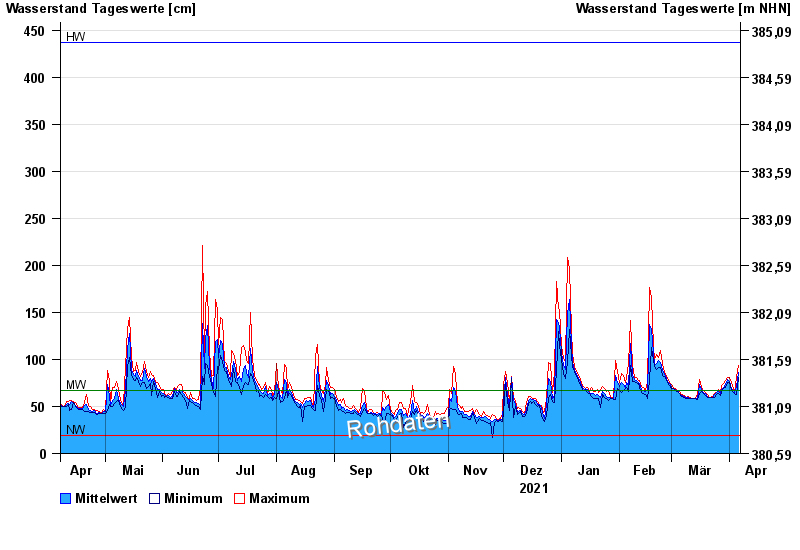
- Naab - Regen >
- Pulling >
- Jahresgrafik

Jahresgrafik Pulling / Regen
Wasserstand vom 07.04.2021 bis zum 06.04.2022
| Datum | Mittelwert [cm] | Maximum [cm] | Minimum [cm] |
|---|---|---|---|
| 06.04.2022 | 86 | 94 | 81 |
| 05.04.2022 | 71 | 81 | 63 |
| 04.04.2022 | 65 | 65 | 64 |
| 03.04.2022 | 67 | 69 | 65 |
| 02.04.2022 | 69 | 75 | 68 |
| 01.04.2022 | 77 | 81 | 75 |
| 31.03.2022 | 79 | 81 | 76 |
© Bayerisches Landesamt für Umwelt 2024