
- Startseite >
- Flüsse >
- Wasserstand >
- Naab - Regen >
- Pulling >
- Jahresgrafik

Jahresgrafik Pulling / Regen
Wasserstand vom 01.01.2014 bis zum 31.12.2014
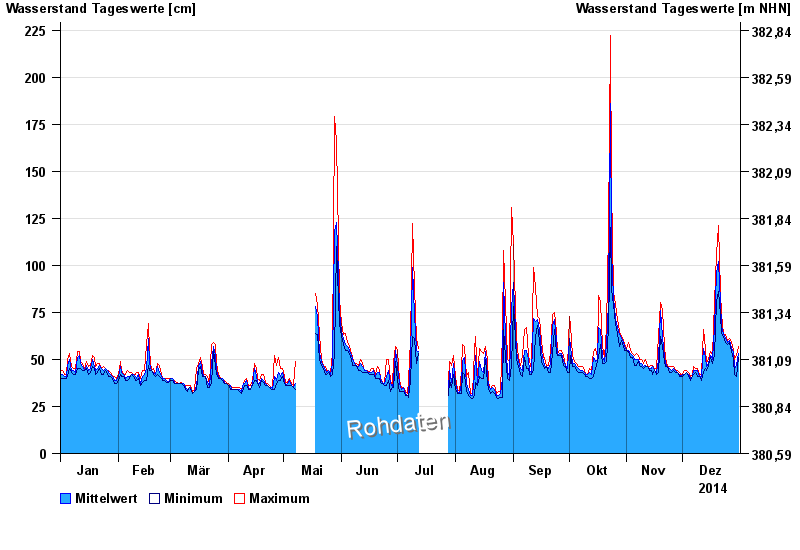
| Datum | Mittelwert [cm] | Maximum [cm] | Minimum [cm] |
|---|---|---|---|
| 31.12.2014 | 53 | 57 | 51 |
| 30.12.2014 | 47 | 52 | 41 |
| 29.12.2014 | 45 | 50 | 42 |
| 28.12.2014 | 54 | 55 | 50 |
| 27.12.2014 | 56 | 59 | 54 |
| 26.12.2014 | 60 | 61 | 59 |
| 25.12.2014 | 59 | 60 | 58 |
© Bayerisches Landesamt für Umwelt 2024