
- Startseite >
- Flüsse >
- Wasserstand >
- Naab - Regen >
- Pulling >
- Jahresgrafik

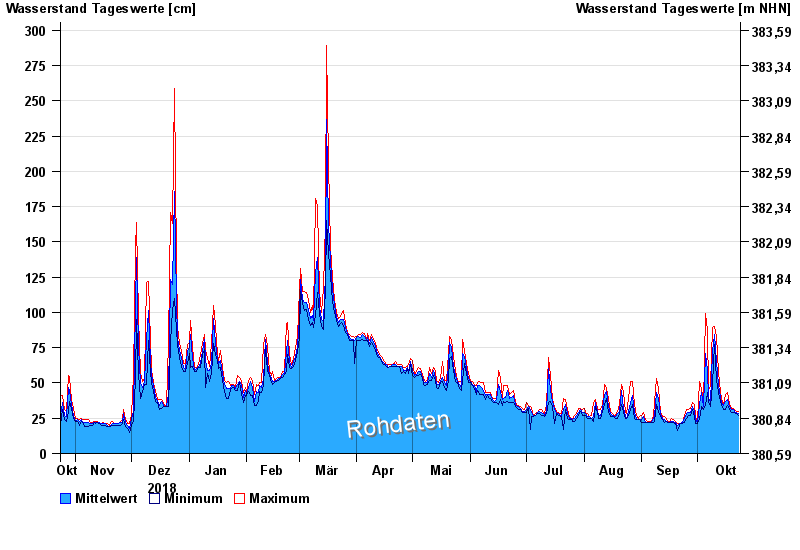
Jahresgrafik Pulling / Regen
Wasserstand vom 24.10.2018 bis zum 23.10.2019
| Datum | Mittelwert [cm] | Maximum [cm] | Minimum [cm] |
|---|---|---|---|
| 23.10.2019 | 28 | 30 | 27 |
| 22.10.2019 | 29 | 30 | 28 |
| 21.10.2019 | 30 | 31 | 29 |
| 20.10.2019 | 31 | 32 | 29 |
| 19.10.2019 | 31 | 32 | 29 |
| 18.10.2019 | 33 | 35 | 31 |
| 17.10.2019 | 38 | 43 | 34 |
© Bayerisches Landesamt für Umwelt 2024