
- Startseite >
- Flüsse >
- Wasserstand >
- Naab - Regen >
- Pulling >
- Jahresgrafik

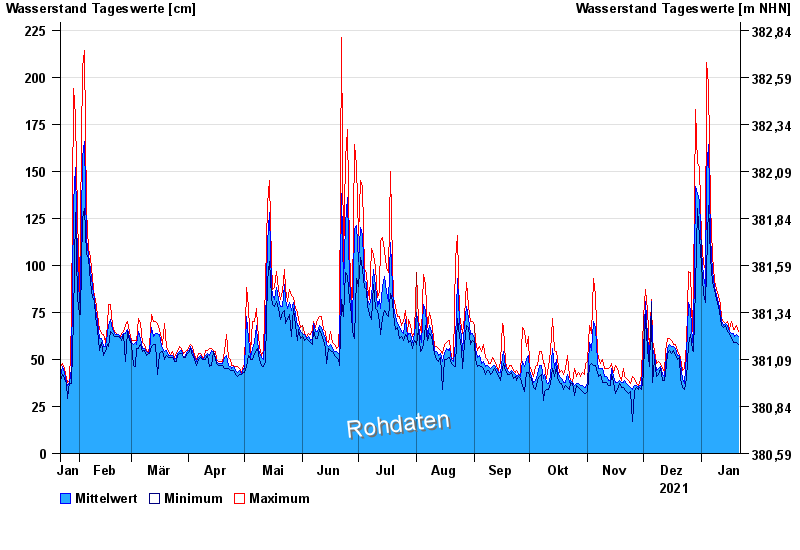
Jahresgrafik Pulling / Regen
Wasserstand vom 22.01.2021 bis zum 21.01.2022
| Datum | Mittelwert [cm] | Maximum [cm] | Minimum [cm] |
|---|---|---|---|
| 21.01.2022 | 62 | 65 | 58 |
| 20.01.2022 | 63 | 68 | 59 |
| 19.01.2022 | 62 | 66 | 59 |
| 18.01.2022 | 64 | 66 | 59 |
| 17.01.2022 | 64 | 70 | 61 |
| 16.01.2022 | 65 | 66 | 64 |
| 15.01.2022 | 68 | 70 | 65 |
© Bayerisches Landesamt für Umwelt 2024