
- Startseite >
- Flüsse >
- Wasserstand >
- Naab - Regen >
- Pulling >
- Jahresgrafik

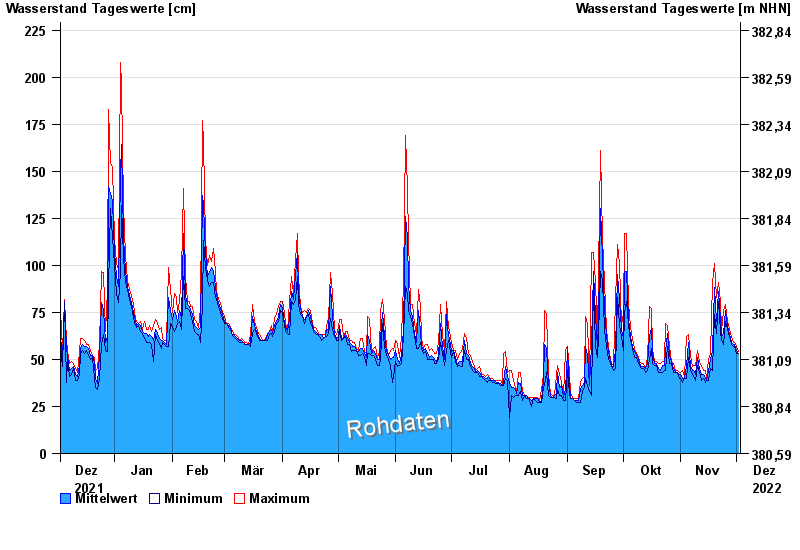
Jahresgrafik Pulling / Regen
Wasserstand vom 03.12.2021 bis zum 02.12.2022
| Datum | Mittelwert [cm] | Maximum [cm] | Minimum [cm] |
|---|---|---|---|
| 02.12.2022 | 53 | 54 | 53 |
| 01.12.2022 | 55 | 57 | 53 |
| 30.11.2022 | 58 | 59 | 57 |
| 29.11.2022 | 58 | 59 | 57 |
| 28.11.2022 | 59 | 62 | 58 |
| 27.11.2022 | 63 | 66 | 62 |
| 26.11.2022 | 68 | 70 | 66 |
© Bayerisches Landesamt für Umwelt 2024