
- Startseite >
- Flüsse >
- Wasserstand >
- Naab - Regen >
- Pulling >
- Jahresgrafik

Jahresgrafik Pulling / Regen
Wasserstand vom 03.12.2019 bis zum 02.12.2020
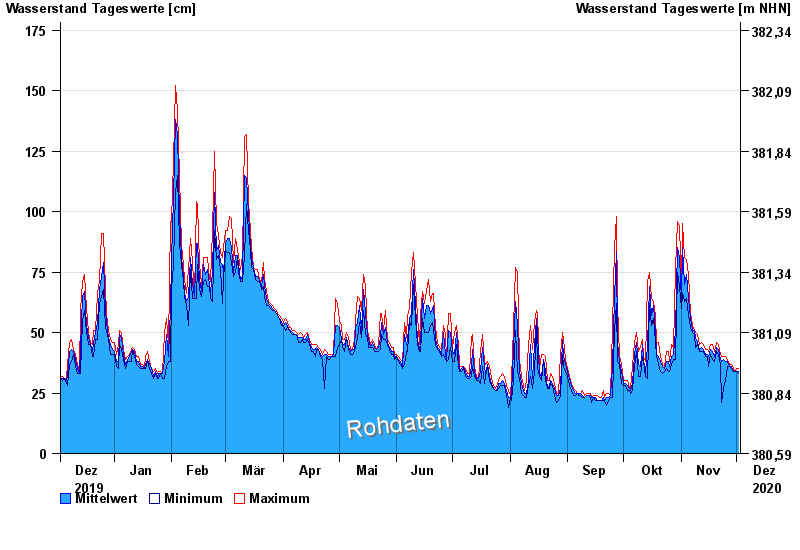
| Datum | Mittelwert [cm] | Maximum [cm] | Minimum [cm] |
|---|---|---|---|
| 02.12.2020 | 34 | 35 | 33 |
| 01.12.2020 | 34 | 35 | 34 |
| 30.11.2020 | 34 | 34 | 34 |
| 29.11.2020 | 34 | 35 | 34 |
| 28.11.2020 | 36 | 37 | 35 |
| 27.11.2020 | 36 | 37 | 36 |
| 26.11.2020 | 38 | 39 | 36 |
© Bayerisches Landesamt für Umwelt 2024