
- Startseite >
- Flüsse >
- Wasserstand >
- Naab - Regen >
- Plattling >
- Jahresgrafik

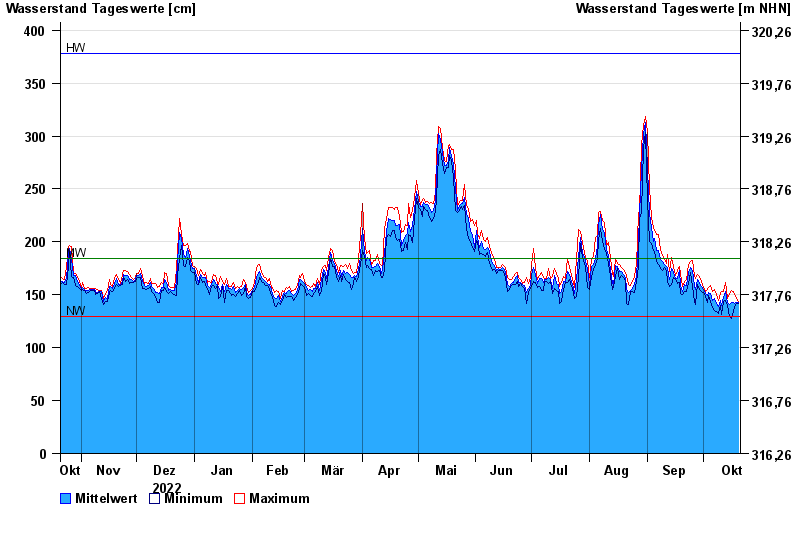
Jahresgrafik Plattling / Isar
Wasserstand vom 21.10.2022 bis zum 20.10.2023
| Datum | Mittelwert [cm] | Maximum [cm] | Minimum [cm] |
|---|---|---|---|
| 20.10.2023 | 143 | 144 | 142 |
| 19.10.2023 | 143 | 146 | 142 |
| 18.10.2023 | 142 | 150 | 139 |
| 17.10.2023 | 143 | 153 | 134 |
| 16.10.2023 | 143 | 154 | 128 |
| 15.10.2023 | 141 | 150 | 129 |
| 14.10.2023 | 143 | 146 | 140 |
© Bayerisches Landesamt für Umwelt 2024