
- Startseite >
- Flüsse >
- Wasserstand >
- Naab - Regen >
- Parsberg >
- Jahresgrafik

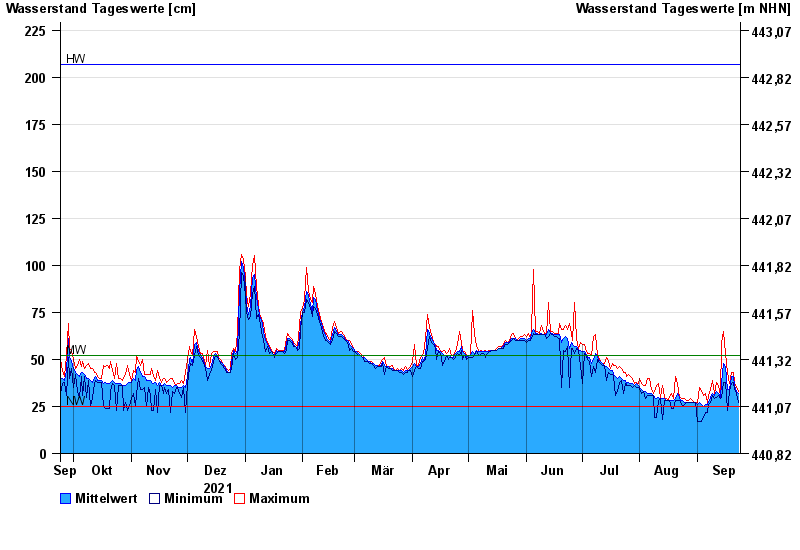
Jahresgrafik Parsberg / Schwarze Laber
Wasserstand vom 24.09.2021 bis zum 23.09.2022
| Datum | Mittelwert [cm] | Maximum [cm] | Minimum [cm] |
|---|---|---|---|
| 23.09.2022 | 32 | 33 | 27 |
| 22.09.2022 | 33 | 35 | 32 |
| 21.09.2022 | 36 | 38 | 34 |
| 20.09.2022 | 41 | 43 | 38 |
| 19.09.2022 | 41 | 43 | 37 |
| 18.09.2022 | 34 | 37 | 33 |
| 17.09.2022 | 34 | 43 | 23 |
© Bayerisches Landesamt für Umwelt 2024