
- Startseite >
- Flüsse >
- Wasserstand >
- Naab - Regen >
- Obersdorf >
- Monatsgrafik

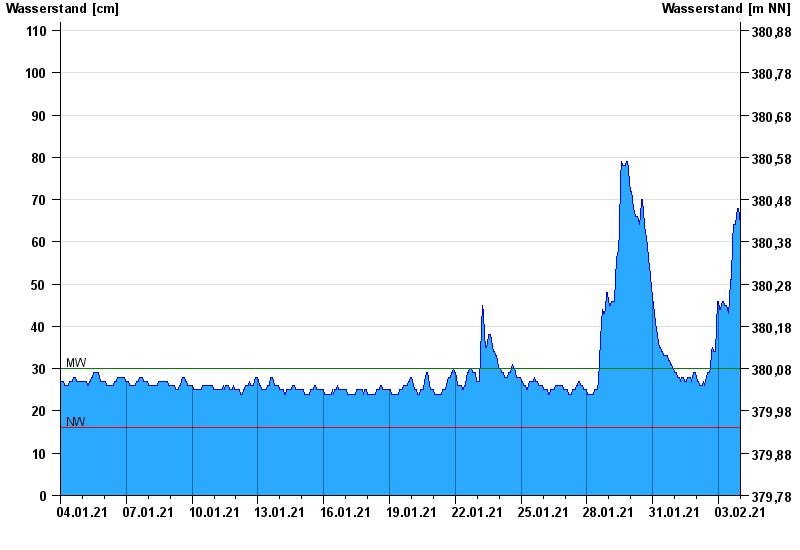
Monatsgrafik Obersdorf / Rosenbach
Wasserstand vom 04.01.2021 bis zum 03.02.2021
| Datum | Wasserstand [cm] |
|---|---|
| 03.02.2021 23:45 | 63 |
| 03.02.2021 23:30 | 64 |
| 03.02.2021 23:15 | 65 |
| 03.02.2021 23:00 | 65 |
| 03.02.2021 22:45 | 66 |
| 03.02.2021 22:30 | 66 |
| 03.02.2021 22:15 | 67 |
© Bayerisches Landesamt für Umwelt 2024