
- Startseite >
- Flüsse >
- Wasserstand >
- Naab - Regen >
- Langenbruck >
- Jahresgrafik

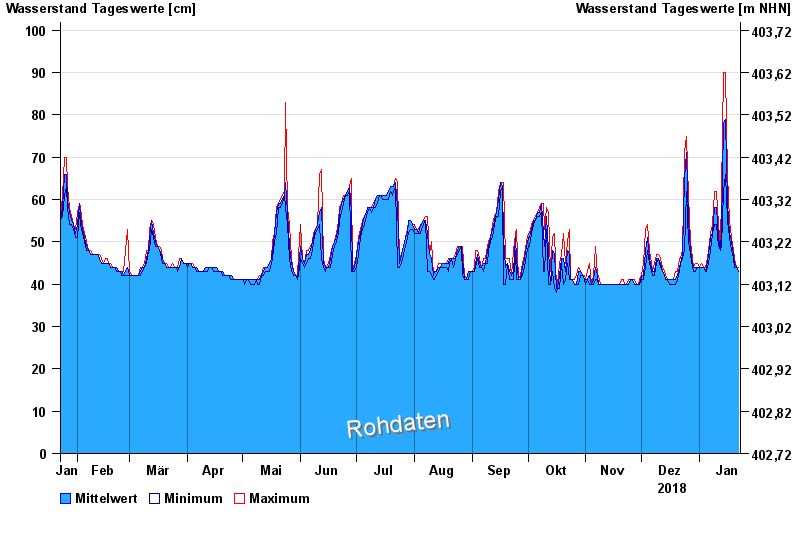
Jahresgrafik Langenbruck / Frankenohe
Wasserstand vom 23.01.2018 bis zum 22.01.2019
| Datum | Mittelwert [cm] | Maximum [cm] | Minimum [cm] |
|---|---|---|---|
| 22.01.2019 | 43 | 44 | 43 |
| 21.01.2019 | 44 | 44 | 44 |
| 20.01.2019 | 45 | 46 | 44 |
| 19.01.2019 | 47 | 48 | 46 |
| 18.01.2019 | 50 | 51 | 48 |
| 17.01.2019 | 52 | 55 | 51 |
| 16.01.2019 | 59 | 66 | 55 |
© Bayerisches Landesamt für Umwelt 2024