
- Startseite >
- Flüsse >
- Wasserstand >
- Naab - Regen >
- Kempten >
- Jahresgrafik

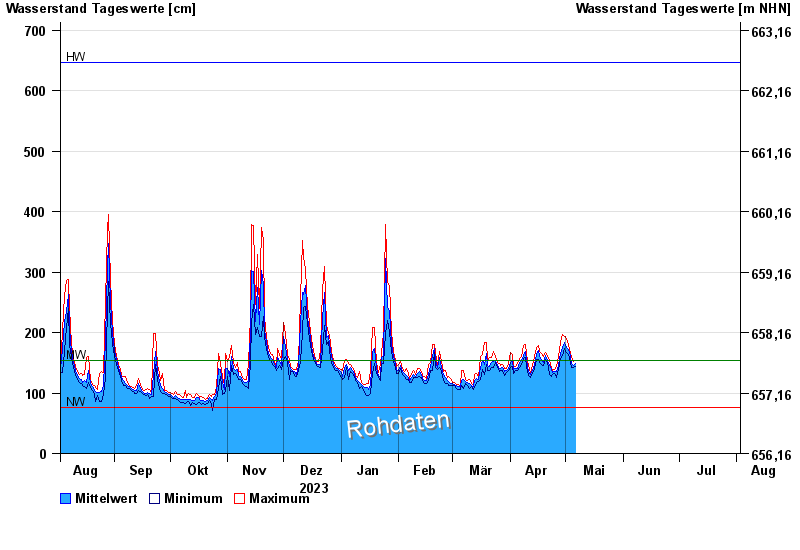
Jahresgrafik Kempten / Iller
Wasserstand vom 03.08.2023 bis zum 02.08.2024
| Datum | Mittelwert [cm] | Maximum [cm] | Minimum [cm] |
|---|---|---|---|
| 16.06.2024 | 155 | 159 | 150 |
| 15.06.2024 | 148 | 153 | 143 |
| 14.06.2024 | 149 | 157 | 138 |
| 13.06.2024 | 158 | 164 | 152 |
| 12.06.2024 | 175 | 185 | 165 |
| 11.06.2024 | 195 | 204 | 185 |
| 10.06.2024 | 216 | 227 | 205 |
© Bayerisches Landesamt für Umwelt 2024