
- Startseite >
- Flüsse >
- Wasserstand >
- Naab - Regen >
- Gogl-Mühle >
- Jahresgrafik

Jahresgrafik Gogl-Mühle / Chamb
Wasserstand vom 28.04.2024 bis zum 27.04.2025
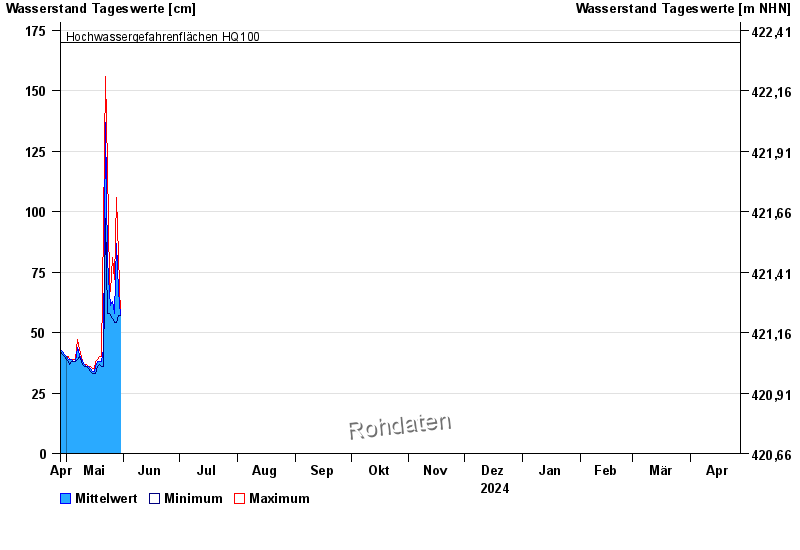
- Hochwassergefahrenfläche HQ100 170 cm
| Datum | Mittelwert [cm] | Maximum [cm] | Minimum [cm] |
|---|---|---|---|
| 08.05.2024 | 42 | 43 | 42 |
| 07.05.2024 | 44 | 47 | 39 |
| 06.05.2024 | 38 | 39 | 38 |
| 05.05.2024 | 38 | 39 | 38 |
| 04.05.2024 | 39 | 39 | 38 |
| 03.05.2024 | 39 | 39 | 37 |
| 02.05.2024 | 39 | 40 | 38 |
© Bayerisches Landesamt für Umwelt 2024