
- Startseite >
- Flüsse >
- Wasserstand >
- Naab - Regen >
- Geisleithen >
- Jahresgrafik

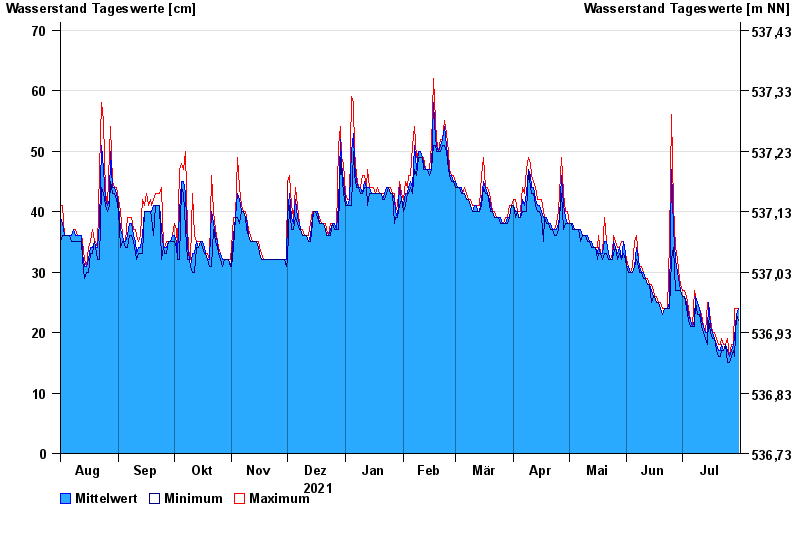
Jahresgrafik Geisleithen / Geisbach
Wasserstand vom 01.08.2021 bis zum 31.07.2022
- 05.06.2011 Wasserstand: 94 cm
- 14.06.2020 Wasserstand: 84 cm
- 28.05.2006 Wasserstand: 81 cm
- 16.05.2006 Wasserstand: 80 cm
- 31.03.2006 Wasserstand: 77 cm
| Datum | Mittelwert [cm] | Maximum [cm] | Minimum [cm] |
|---|---|---|---|
| 31.07.2022 | 24 | 24 | 22 |
| 30.07.2022 | 23 | 24 | 23 |
| 29.07.2022 | 19 | 24 | 16 |
| 28.07.2022 | 18 | 18 | 17 |
| 27.07.2022 | 17 | 18 | 16 |
| 26.07.2022 | 16 | 16 | 15 |
| 25.07.2022 | 17 | 19 | 15 |
© Bayerisches Landesamt für Umwelt 2024