
- Startseite >
- Flüsse >
- Wasserstand >
- Naab - Regen >
- Gartenried >
- Jahresgrafik

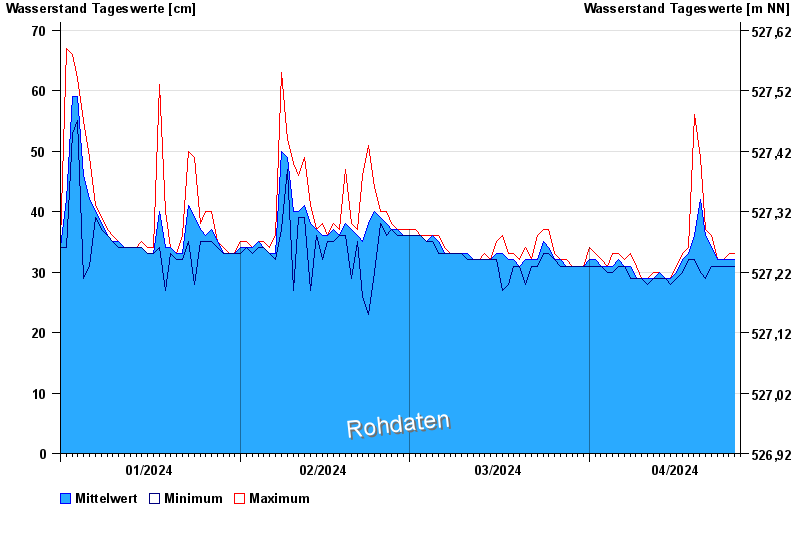
Jahresgrafik Gartenried / Murach
Wasserstand vom 01.01.2024 bis zum 26.04.2024
 Für diesen Pegel sind keine Meldestufen hinterlegt.
| Datum | Mittelwert [cm] | Maximum [cm] | Minimum [cm] |
|---|---|---|---|
| 26.04.2024 | 32 | 33 | 32 |
| 25.04.2024 | 32 | 33 | 31 |
| 24.04.2024 | 32 | 32 | 31 |
| 23.04.2024 | 32 | 32 | 31 |
| 22.04.2024 | 34 | 36 | 31 |
| 21.04.2024 | 36 | 37 | 29 |
| 20.04.2024 | 42 | 49 | 30 |
© Bayerisches Landesamt für Umwelt 2024