
- Startseite >
- Flüsse >
- Wasserstand >
- Naab - Regen >
- Erbendorf >
- Jahresgrafik

Jahresgrafik Erbendorf / Fichtelnaab
Wasserstand vom 18.04.2019 bis zum 17.04.2020
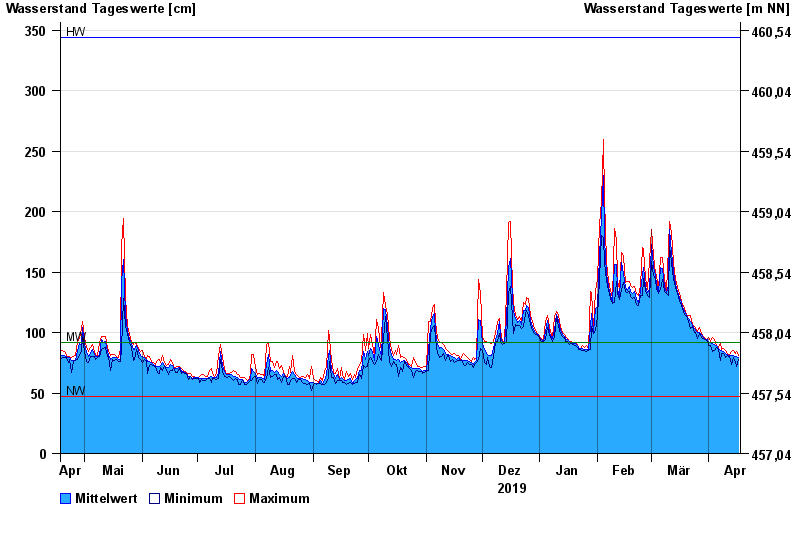
| Datum | Mittelwert [cm] | Maximum [cm] | Minimum [cm] |
|---|---|---|---|
| 17.04.2020 | 79 | 81 | 78 |
| 16.04.2020 | 80 | 84 | 72 |
| 15.04.2020 | 80 | 83 | 75 |
| 14.04.2020 | 81 | 85 | 79 |
| 13.04.2020 | 81 | 84 | 74 |
| 12.04.2020 | 81 | 82 | 80 |
| 11.04.2020 | 82 | 83 | 81 |
© Bayerisches Landesamt für Umwelt 2024