
- Startseite >
- Flüsse >
- Wasserstand >
- Naab - Regen >
- Erbendorf >
- Jahresgrafik

Jahresgrafik Erbendorf / Fichtelnaab
Wasserstand vom 08.05.2021 bis zum 07.05.2022
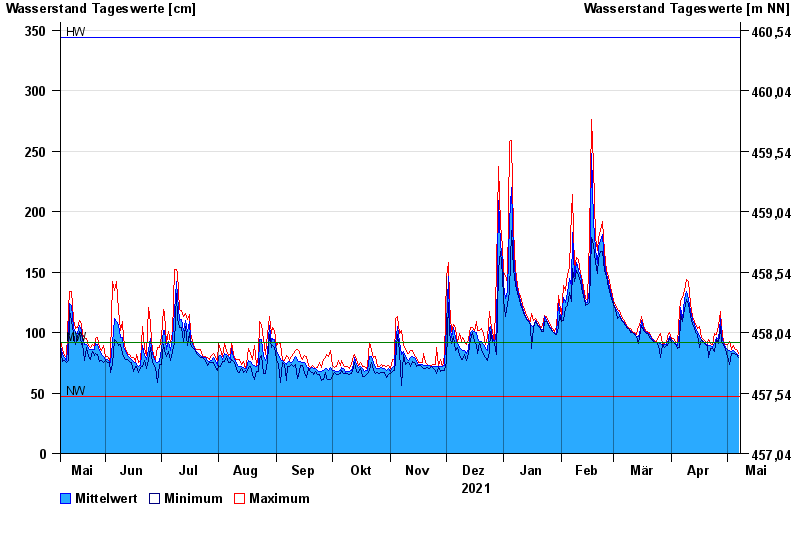
| Datum | Mittelwert [cm] | Maximum [cm] | Minimum [cm] |
|---|---|---|---|
| 07.05.2022 | 81 | 83 | 79 |
| 06.05.2022 | 83 | 86 | 82 |
| 05.05.2022 | 84 | 87 | 83 |
| 04.05.2022 | 85 | 89 | 83 |
| 03.05.2022 | 84 | 86 | 83 |
| 02.05.2022 | 85 | 93 | 74 |
| 01.05.2022 | 86 | 90 | 80 |
© Bayerisches Landesamt für Umwelt 2024