
- Startseite >
- Flüsse >
- Wasserstand >
- Naab - Regen >
- Erbendorf >
- Jahresgrafik

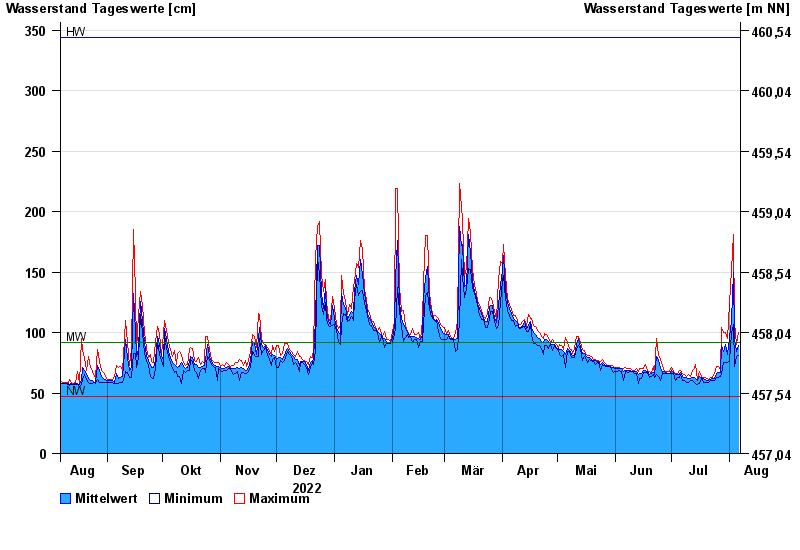
Jahresgrafik Erbendorf / Fichtelnaab
Wasserstand vom 07.08.2022 bis zum 06.08.2023
| Datum | Mittelwert [cm] | Maximum [cm] | Minimum [cm] |
|---|---|---|---|
| 06.08.2023 | 89 | 100 | 81 |
| 05.08.2023 | 84 | 90 | 80 |
| 04.08.2023 | 95 | 108 | 72 |
| 03.08.2023 | 150 | 181 | 107 |
| 02.08.2023 | 110 | 152 | 99 |
| 01.08.2023 | 96 | 124 | 76 |
| 31.07.2023 | 82 | 95 | 75 |
© Bayerisches Landesamt für Umwelt 2024