
- Startseite >
- Flüsse >
- Wasserstand >
- Naab - Regen >
- Deuerling >
- Jahresgrafik

Jahresgrafik Deuerling / Schwarze Laber
Wasserstand vom 20.02.2020 bis zum 19.02.2021
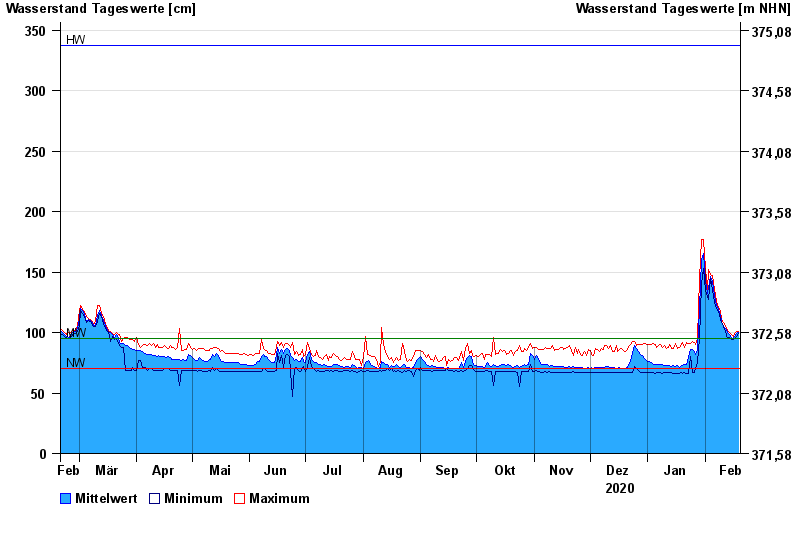
| Datum | Mittelwert [cm] | Maximum [cm] | Minimum [cm] |
|---|---|---|---|
| 19.02.2021 | 100 | 101 | 99 |
| 18.02.2021 | 99 | 101 | 97 |
| 17.02.2021 | 97 | 99 | 95 |
| 16.02.2021 | 95 | 97 | 94 |
| 15.02.2021 | 96 | 98 | 94 |
| 14.02.2021 | 98 | 100 | 96 |
| 13.02.2021 | 100 | 102 | 95 |
© Bayerisches Landesamt für Umwelt 2024