
- Startseite >
- Flüsse >
- Wasserstand >
- Naab - Regen >
- Deuerling >
- Jahresgrafik

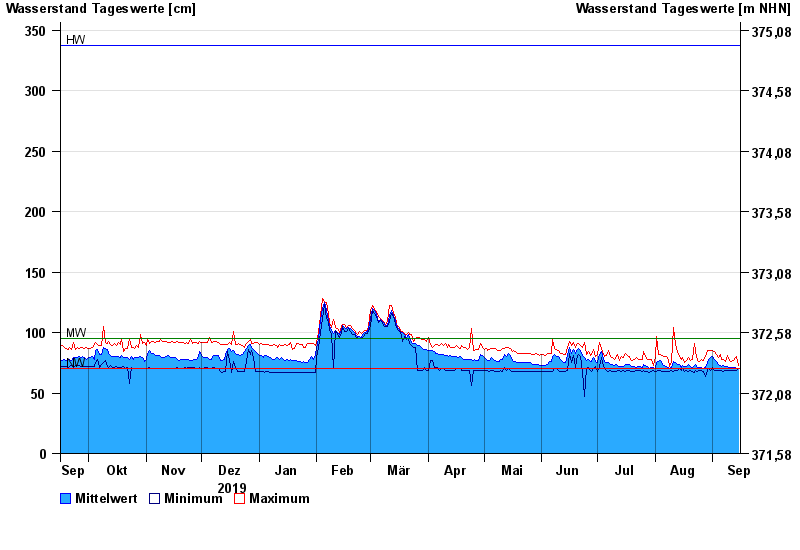
Jahresgrafik Deuerling / Schwarze Laber
Wasserstand vom 16.09.2019 bis zum 15.09.2020
| Datum | Mittelwert [cm] | Maximum [cm] | Minimum [cm] |
|---|---|---|---|
| 15.09.2020 | 70 | 73 | 70 |
| 14.09.2020 | 70 | 80 | 69 |
| 13.09.2020 | 71 | 79 | 69 |
| 12.09.2020 | 71 | 77 | 69 |
| 11.09.2020 | 71 | 76 | 69 |
| 10.09.2020 | 71 | 77 | 69 |
| 09.09.2020 | 72 | 81 | 69 |
© Bayerisches Landesamt für Umwelt 2024