
- Startseite >
- Flüsse >
- Wasserstand >
- Naab - Regen >
- Deuerling >
- Jahresgrafik

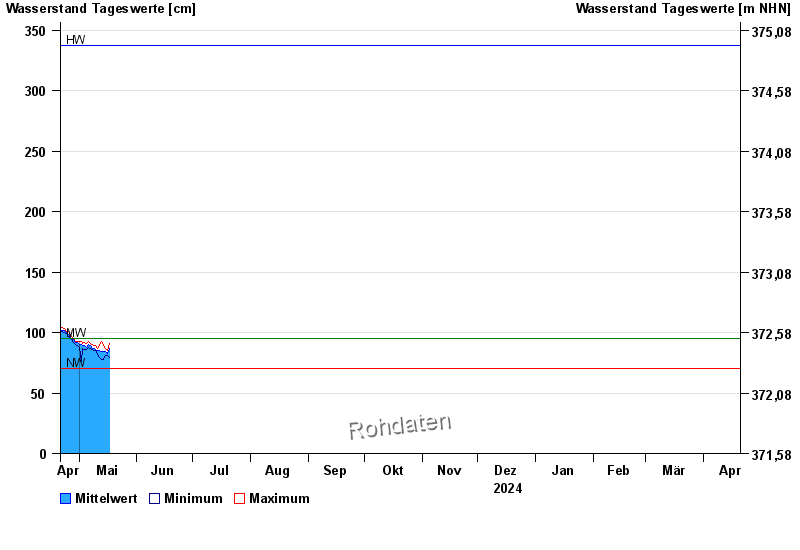
Jahresgrafik Deuerling / Schwarze Laber
Wasserstand vom 21.04.2024 bis zum 20.04.2025
| Datum | Mittelwert [cm] | Maximum [cm] | Minimum [cm] |
|---|---|---|---|
| 08.06.2024 | 114 | 114 | 113 |
| 07.06.2024 | 118 | 121 | 114 |
| 06.06.2024 | 124 | 127 | 118 |
| 05.06.2024 | 135 | 145 | 127 |
| 04.06.2024 | 156 | 171 | 141 |
| 03.06.2024 | 162 | 173 | 156 |
| 02.06.2024 | 165 | 174 | 152 |
© Bayerisches Landesamt für Umwelt 2024