
- Startseite >
- Flüsse >
- Wasserstand >
- Naab - Regen >
- Böhmischbruck >
- Jahresgrafik

Jahresgrafik Böhmischbruck / Pfreimd
Wasserstand vom 28.10.2020 bis zum 27.10.2021
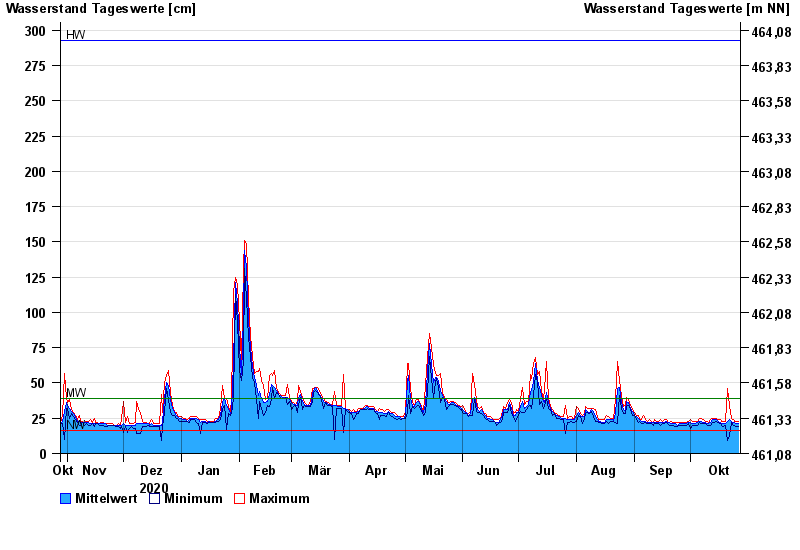
| Datum | Mittelwert [cm] | Maximum [cm] | Minimum [cm] |
|---|---|---|---|
| 27.10.2021 | 21 | 23 | 19 |
| 26.10.2021 | 21 | 23 | 19 |
| 25.10.2021 | 22 | 23 | 20 |
| 24.10.2021 | 22 | 24 | 20 |
| 23.10.2021 | 23 | 25 | 22 |
| 22.10.2021 | 24 | 34 | 13 |
| 21.10.2021 | 23 | 46 | 9 |
© Bayerisches Landesamt für Umwelt 2024