
- Startseite >
- Flüsse >
- Wasserstand >
- Naab - Regen >
- Böhmischbruck >
- Jahresgrafik

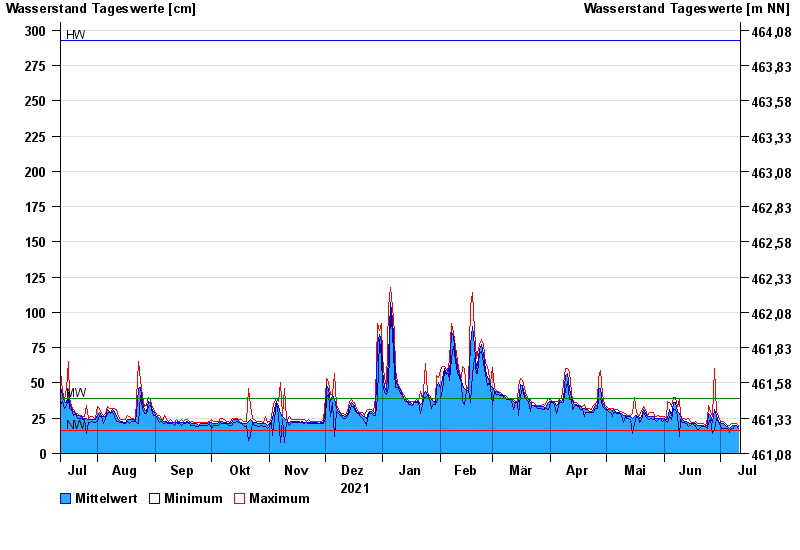
Jahresgrafik Böhmischbruck / Pfreimd
Wasserstand vom 12.07.2021 bis zum 11.07.2022
| Datum | Mittelwert [cm] | Maximum [cm] | Minimum [cm] |
|---|---|---|---|
| 11.07.2022 | 19 | 20 | 18 |
| 10.07.2022 | 20 | 21 | 20 |
| 09.07.2022 | 20 | 21 | 20 |
| 08.07.2022 | 20 | 21 | 18 |
| 07.07.2022 | 19 | 21 | 18 |
| 06.07.2022 | 18 | 20 | 15 |
| 05.07.2022 | 19 | 20 | 18 |
© Bayerisches Landesamt für Umwelt 2024