
- Startseite >
- Flüsse >
- Wasserstand >
- Naab - Regen >
- Böhmischbruck >
- Jahresgrafik

Jahresgrafik Böhmischbruck / Pfreimd
Wasserstand vom 19.04.2024 bis zum 18.04.2025
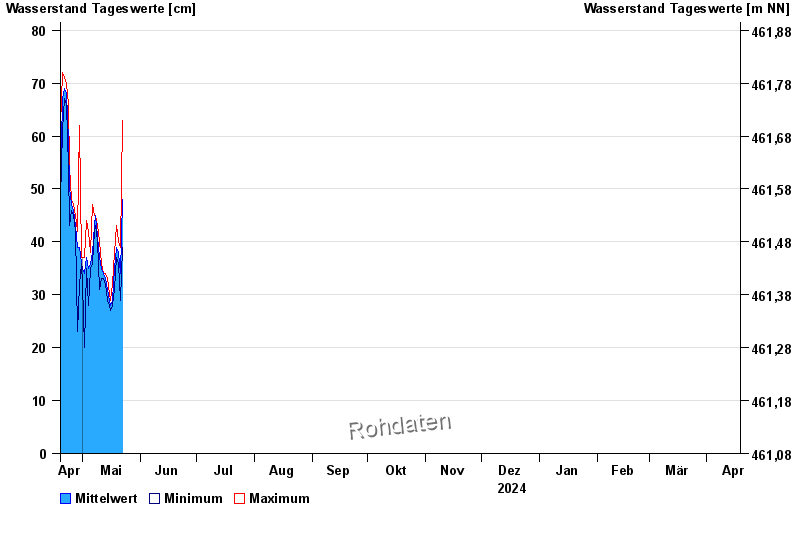
| Datum | Mittelwert [cm] | Maximum [cm] | Minimum [cm] |
|---|---|---|---|
| 02.05.2024 | 35 | 35 | 34 |
| 01.05.2024 | 35 | 37 | 32 |
| 30.04.2024 | 36 | 37 | 36 |
| 29.04.2024 | 39 | 62 | 32 |
| 28.04.2024 | 39 | 42 | 23 |
| 27.04.2024 | 43 | 45 | 42 |
| 26.04.2024 | 46 | 47 | 45 |
© Bayerisches Landesamt für Umwelt 2024