
- Startseite >
- Flüsse >
- Wasserstand >
- Unterer Main >
- Wertheim >
- Jahresgrafik

Jahresgrafik Wertheim / Main
Wasserstand vom 29.01.2022 bis zum 28.01.2023
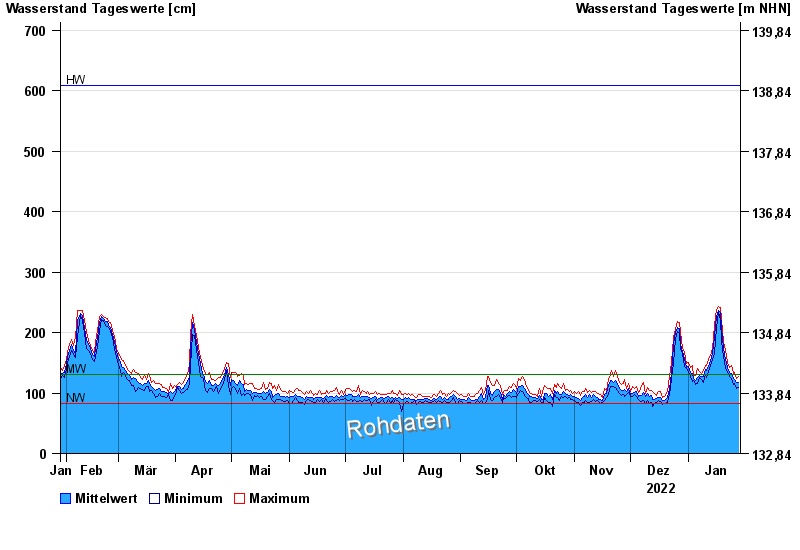
| Datum | Mittelwert [cm] | Maximum [cm] | Minimum [cm] |
|---|---|---|---|
| 28.01.2023 | 117 | 128 | 109 |
| 27.01.2023 | 117 | 124 | 107 |
| 26.01.2023 | 123 | 134 | 116 |
| 25.01.2023 | 124 | 132 | 114 |
| 24.01.2023 | 132 | 145 | 124 |
| 23.01.2023 | 134 | 142 | 127 |
| 22.01.2023 | 143 | 150 | 135 |
© Bayerisches Landesamt für Umwelt 2024