
- Startseite >
- Flüsse >
- Wasserstand >
- Unterer Main >
- Wertheim >
- Jahresgrafik

Jahresgrafik Wertheim / Main
Wasserstand vom 29.01.2021 bis zum 28.01.2022
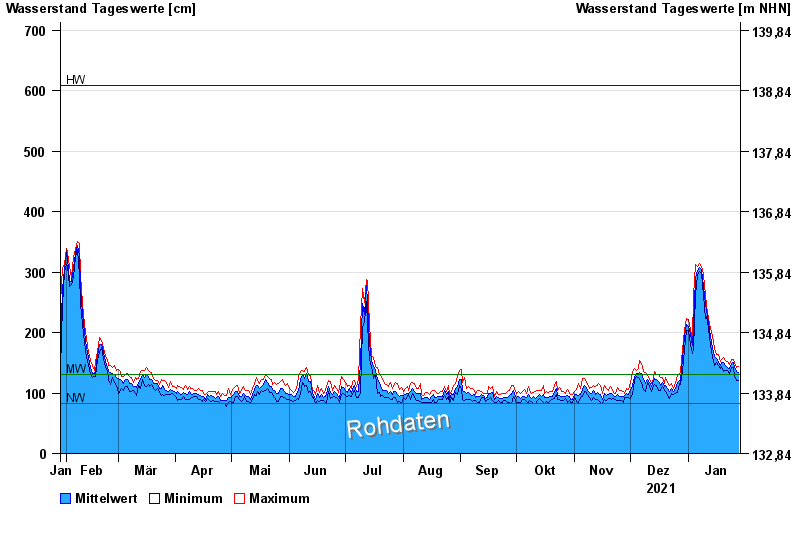
| Datum | Mittelwert [cm] | Maximum [cm] | Minimum [cm] |
|---|---|---|---|
| 28.01.2022 | 134 | 144 | 120 |
| 27.01.2022 | 135 | 143 | 120 |
| 26.01.2022 | 142 | 151 | 128 |
| 25.01.2022 | 150 | 156 | 143 |
| 24.01.2022 | 149 | 155 | 143 |
| 23.01.2022 | 140 | 148 | 132 |
| 22.01.2022 | 142 | 152 | 138 |
© Bayerisches Landesamt für Umwelt 2024