
- Startseite >
- Flüsse >
- Wasserstand >
- Unterer Main >
- Wertheim >
- Jahresgrafik

Jahresgrafik Wertheim / Main
Wasserstand vom 29.01.2020 bis zum 28.01.2021
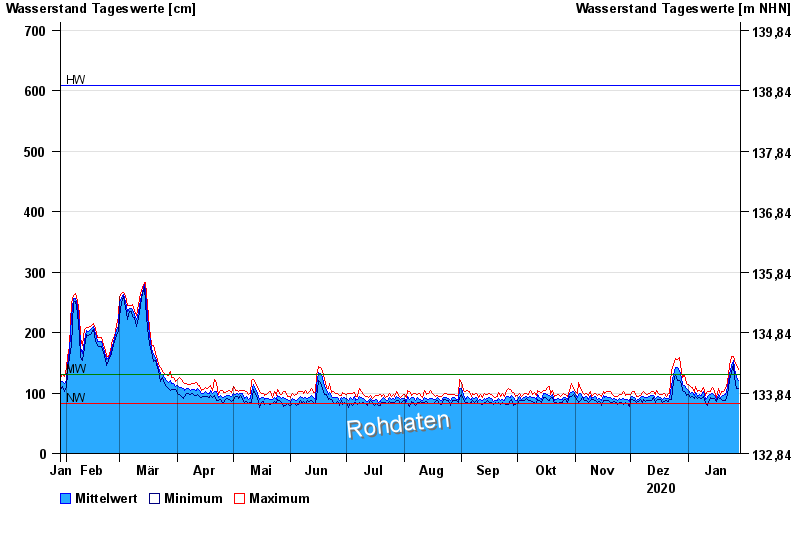
| Datum | Mittelwert [cm] | Maximum [cm] | Minimum [cm] |
|---|---|---|---|
| 28.01.2021 | 120 | 139 | 107 |
| 27.01.2021 | 125 | 146 | 108 |
| 26.01.2021 | 140 | 153 | 126 |
| 25.01.2021 | 154 | 160 | 147 |
| 24.01.2021 | 146 | 160 | 136 |
| 23.01.2021 | 131 | 145 | 120 |
| 22.01.2021 | 109 | 117 | 98 |
© Bayerisches Landesamt für Umwelt 2024