
- Startseite >
- Flüsse >
- Wasserstand >
- Unterer Main >
- Wertheim >
- Jahresgrafik

Jahresgrafik Wertheim / Main
Wasserstand vom 01.01.2017 bis zum 31.12.2017
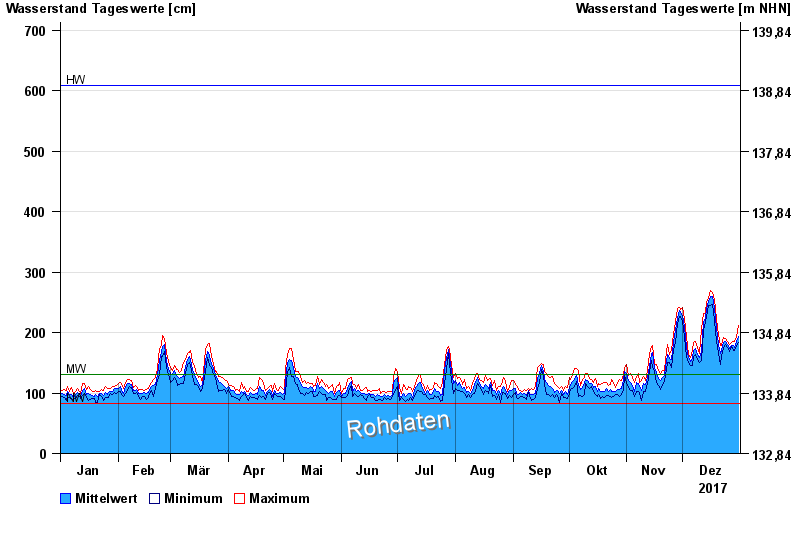
| Datum | Mittelwert [cm] | Maximum [cm] | Minimum [cm] |
|---|---|---|---|
| 31.12.2017 | 194 | 211 | 183 |
| 30.12.2017 | 185 | 191 | 178 |
| 29.12.2017 | 175 | 185 | 170 |
| 28.12.2017 | 178 | 185 | 170 |
| 27.12.2017 | 179 | 183 | 177 |
| 26.12.2017 | 173 | 180 | 169 |
| 25.12.2017 | 181 | 186 | 176 |
© Bayerisches Landesamt für Umwelt 2024