
- Startseite >
- Flüsse >
- Wasserstand >
- Unterer Main >
- Wertheim >
- Jahresgrafik

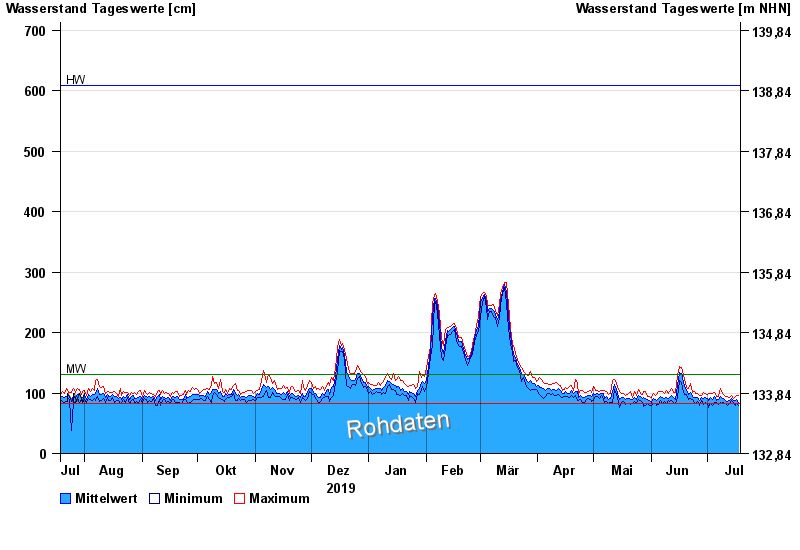
Jahresgrafik Wertheim / Main
Wasserstand vom 19.07.2019 bis zum 18.07.2020
| Datum | Mittelwert [cm] | Maximum [cm] | Minimum [cm] |
|---|---|---|---|
| 18.07.2020 | 85 | 96 | 79 |
| 17.07.2020 | 89 | 96 | 82 |
| 16.07.2020 | 87 | 95 | 80 |
| 15.07.2020 | 87 | 91 | 85 |
| 14.07.2020 | 91 | 96 | 88 |
| 13.07.2020 | 88 | 93 | 83 |
| 12.07.2020 | 86 | 95 | 80 |
© Bayerisches Landesamt für Umwelt 2024