
- Startseite >
- Flüsse >
- Wasserstand >
- Unterer Main >
- Trunstadt >
- Jahresgrafik

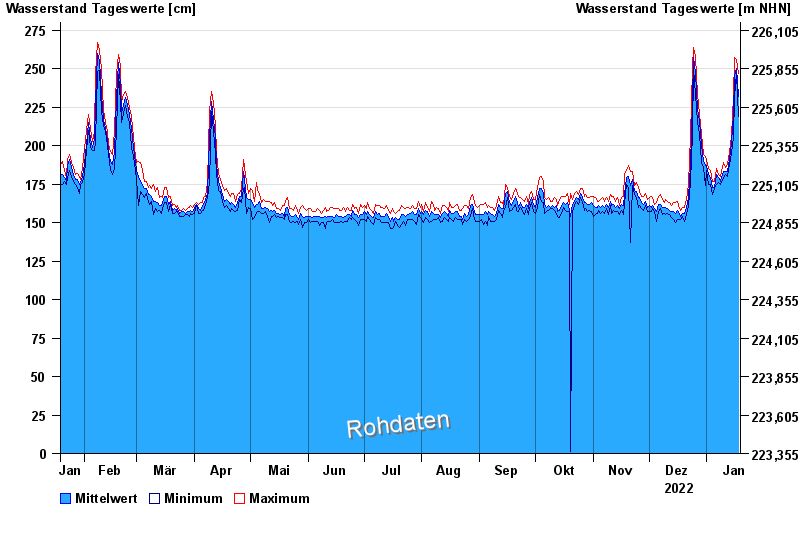
Jahresgrafik Trunstadt / Main
Wasserstand vom 19.01.2022 bis zum 18.01.2023
- 04.01.2003 Wasserstand: 714 cm
- 07.01.1982 Wasserstand: 693 cm
- 27.01.1995 Wasserstand: 686 cm
- 15.01.2011 Wasserstand: 681 cm
- 27.03.1988 Wasserstand: 663 cm
| Datum | Mittelwert [cm] | Maximum [cm] | Minimum [cm] |
|---|---|---|---|
| 18.01.2023 | 232 | 247 | 219 |
| 17.01.2023 | 250 | 256 | 247 |
| 16.01.2023 | 245 | 257 | 232 |
| 15.01.2023 | 221 | 232 | 205 |
| 14.01.2023 | 202 | 206 | 195 |
| 13.01.2023 | 191 | 196 | 188 |
| 12.01.2023 | 183 | 188 | 180 |
© Bayerisches Landesamt für Umwelt 2024