
- Startseite >
- Flüsse >
- Wasserstand >
- Unterer Main >
- Pfarrweisach >
- Jahresgrafik

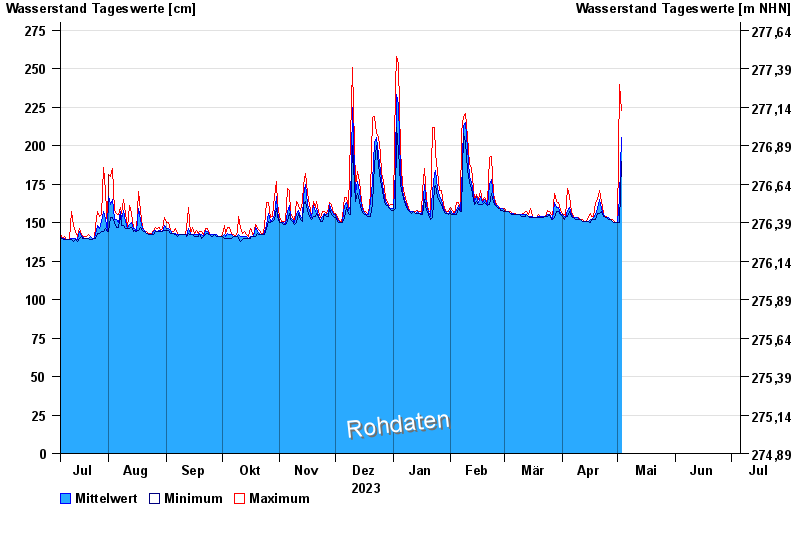
Jahresgrafik Pfarrweisach / Weisach
Wasserstand vom 06.07.2023 bis zum 05.07.2024
| Datum | Mittelwert [cm] | Maximum [cm] | Minimum [cm] |
|---|---|---|---|
| 05.07.2024 | 151 | 152 | 150 |
| 04.07.2024 | 152 | 153 | 151 |
| 03.07.2024 | 153 | 153 | 151 |
| 02.07.2024 | 152 | 155 | 151 |
| 01.07.2024 | 160 | 171 | 155 |
| 30.06.2024 | 154 | 171 | 148 |
| 29.06.2024 | 148 | 148 | 148 |
© Bayerisches Landesamt für Umwelt 2024