
- Startseite >
- Flüsse >
- Wasserstand >
- Unterer Main >
- Pfarrweisach >
- Jahresgrafik

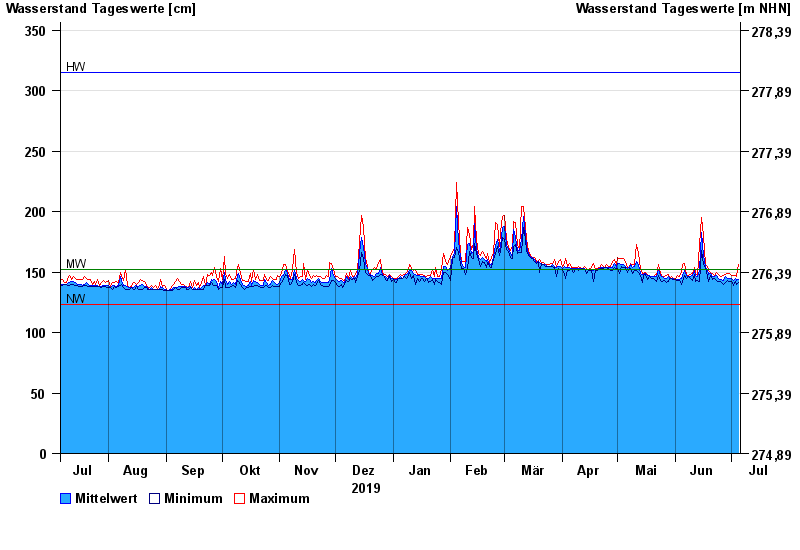
Jahresgrafik Pfarrweisach / Weisach
Wasserstand vom 06.07.2019 bis zum 05.07.2020
| Datum | Mittelwert [cm] | Maximum [cm] | Minimum [cm] |
|---|---|---|---|
| 05.07.2020 | 144 | 156 | 141 |
| 04.07.2020 | 143 | 146 | 140 |
| 03.07.2020 | 145 | 147 | 142 |
| 02.07.2020 | 143 | 147 | 139 |
| 01.07.2020 | 145 | 147 | 142 |
| 30.06.2020 | 145 | 149 | 142 |
| 29.06.2020 | 145 | 149 | 143 |
© Bayerisches Landesamt für Umwelt 2024