
- Startseite >
- Flüsse >
- Wasserstand >
- Unterer Main >
- Pfarrweisach >
- Jahresgrafik

Jahresgrafik Pfarrweisach / Weisach
Wasserstand vom 16.08.2022 bis zum 15.08.2023
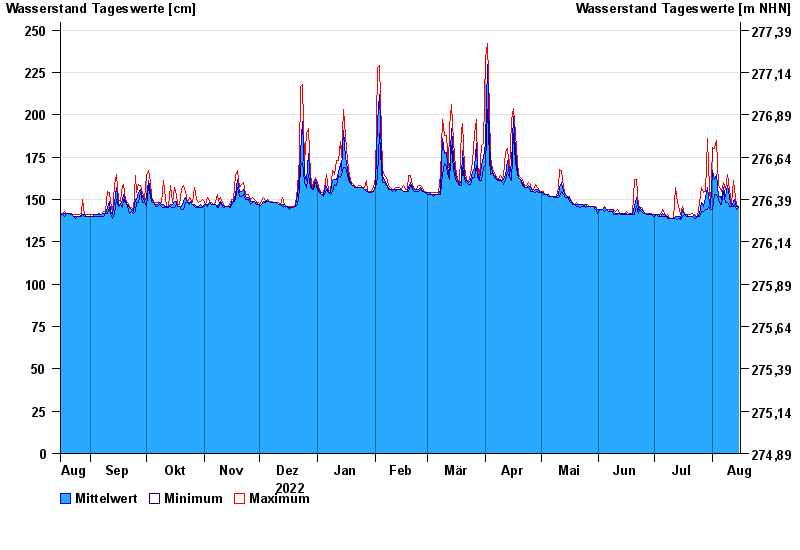
| Datum | Mittelwert [cm] | Maximum [cm] | Minimum [cm] |
|---|---|---|---|
| 15.08.2023 | 146 | 146 | 145 |
| 14.08.2023 | 146 | 147 | 144 |
| 13.08.2023 | 150 | 156 | 147 |
| 12.08.2023 | 149 | 161 | 146 |
| 11.08.2023 | 146 | 147 | 146 |
| 10.08.2023 | 151 | 156 | 146 |
| 09.08.2023 | 158 | 165 | 148 |
© Bayerisches Landesamt für Umwelt 2024