
- Startseite >
- Flüsse >
- Wasserstand >
- Unterer Main >
- Pfarrweisach >
- Jahresgrafik

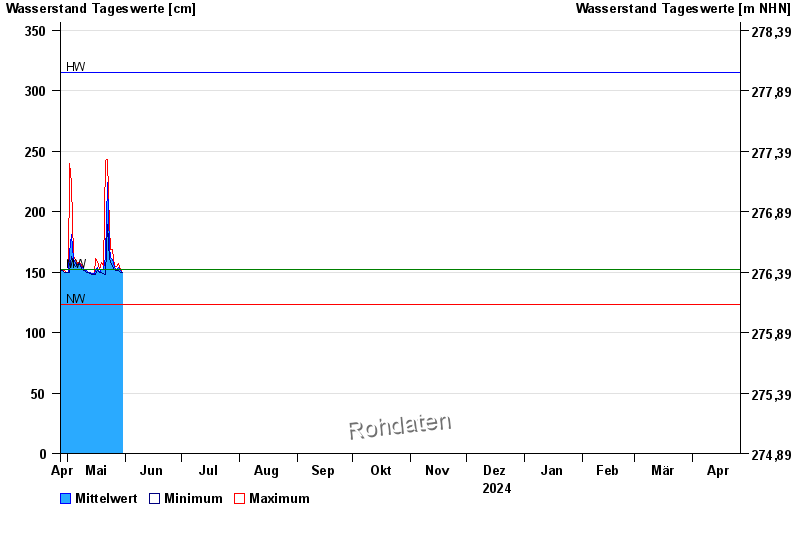
Jahresgrafik Pfarrweisach / Weisach
Wasserstand vom 27.04.2024 bis zum 26.04.2025
| Datum | Mittelwert [cm] | Maximum [cm] | Minimum [cm] |
|---|---|---|---|
| 27.05.2024 | 152 | 152 | 152 |
| 26.05.2024 | 154 | 155 | 152 |
| 25.05.2024 | 160 | 169 | 155 |
| 24.05.2024 | 162 | 169 | 159 |
| 23.05.2024 | 170 | 188 | 160 |
| 22.05.2024 | 224 | 243 | 189 |
| 21.05.2024 | 163 | 242 | 148 |
© Bayerisches Landesamt für Umwelt 2024