
- Startseite >
- Flüsse >
- Wasserstand >
- Unterer Main >
- Obernau >
- Monatsgrafik

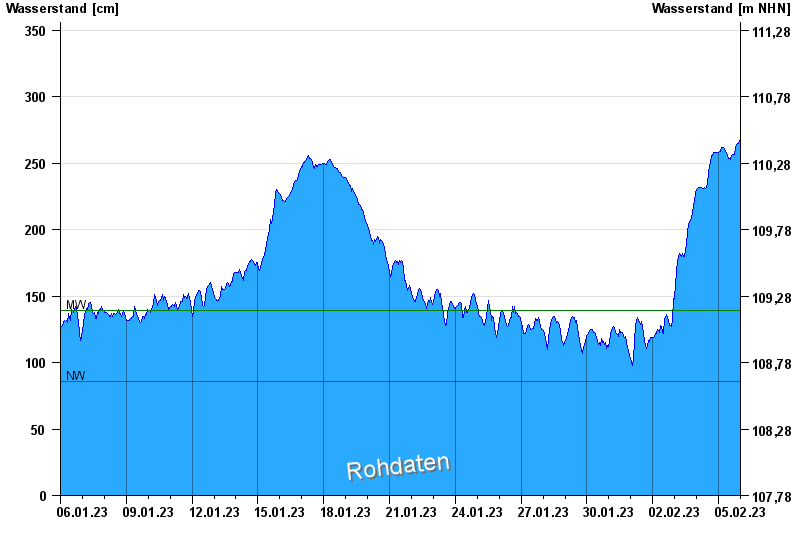
Monatsgrafik Obernau / Main
Wasserstand vom 06.01.2023 bis zum 05.02.2023
| Datum | Wasserstand [cm] |
|---|---|
| 05.02.2023 23:45 | 267 |
| 05.02.2023 23:30 | 268 |
| 05.02.2023 23:15 | 267 |
| 05.02.2023 23:00 | 266 |
| 05.02.2023 22:45 | 265 |
| 05.02.2023 22:30 | 265 |
| 05.02.2023 22:15 | 265 |
© Bayerisches Landesamt für Umwelt 2024