
- Startseite >
- Flüsse >
- Wasserstand >
- Unterer Main >
- Obernau >
- Jahresgrafik

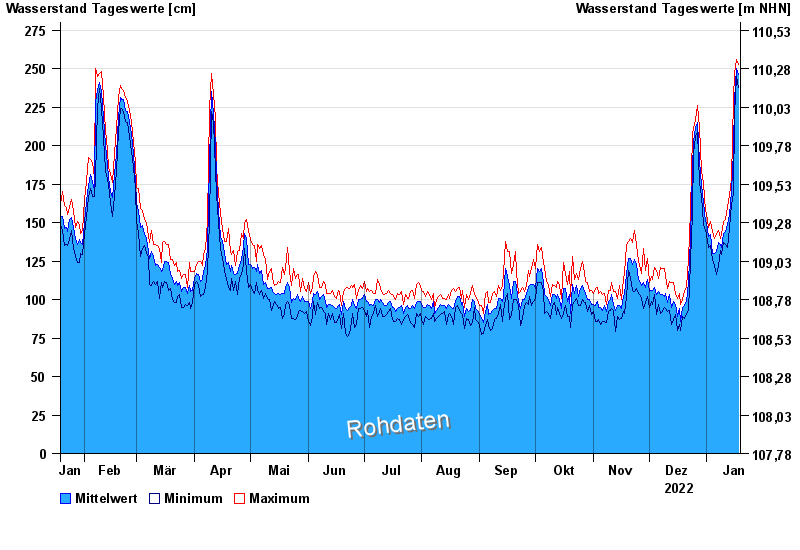
Jahresgrafik Obernau / Main
Wasserstand vom 19.01.2022 bis zum 18.01.2023
- 26.02.1970 Wasserstand: 641 cm
- 30.01.1995 Wasserstand: 639 cm
- 04.01.2003 Wasserstand: 612 cm
- 18.01.2011 Wasserstand: 598 cm
- 09.01.1982 Wasserstand: 593 cm
| Datum | Mittelwert [cm] | Maximum [cm] | Minimum [cm] |
|---|---|---|---|
| 18.01.2023 | 246 | 253 | 238 |
| 17.01.2023 | 250 | 256 | 245 |
| 16.01.2023 | 230 | 247 | 220 |
| 15.01.2023 | 197 | 230 | 169 |
| 14.01.2023 | 170 | 178 | 162 |
| 13.01.2023 | 155 | 168 | 146 |
| 12.01.2023 | 149 | 160 | 134 |
© Bayerisches Landesamt für Umwelt 2024