
- Startseite >
- Flüsse >
- Wasserstand >
- Unterer Main >
- Gollmuthhausen >
- Jahresgrafik

Jahresgrafik Gollmuthhausen / Milz
Wasserstand vom 20.04.2024 bis zum 19.04.2025
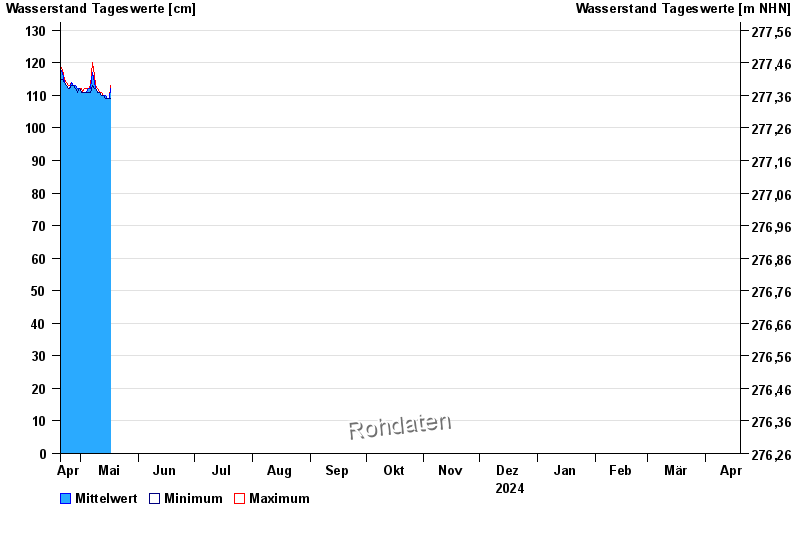
| Datum | Mittelwert [cm] | Maximum [cm] | Minimum [cm] |
|---|---|---|---|
| 02.05.2024 | 111 | 111 | 111 |
| 01.05.2024 | 111 | 112 | 111 |
| 30.04.2024 | 112 | 112 | 112 |
| 29.04.2024 | 112 | 112 | 111 |
| 28.04.2024 | 113 | 113 | 112 |
| 27.04.2024 | 113 | 113 | 113 |
| 26.04.2024 | 114 | 114 | 113 |
© Bayerisches Landesamt für Umwelt 2024