
- Startseite >
- Flüsse >
- Wasserstand >
- Unterer Main >
- Faulbach >
- Jahresgrafik

Jahresgrafik Faulbach / Main
Wasserstand vom 22.09.2021 bis zum 21.09.2022
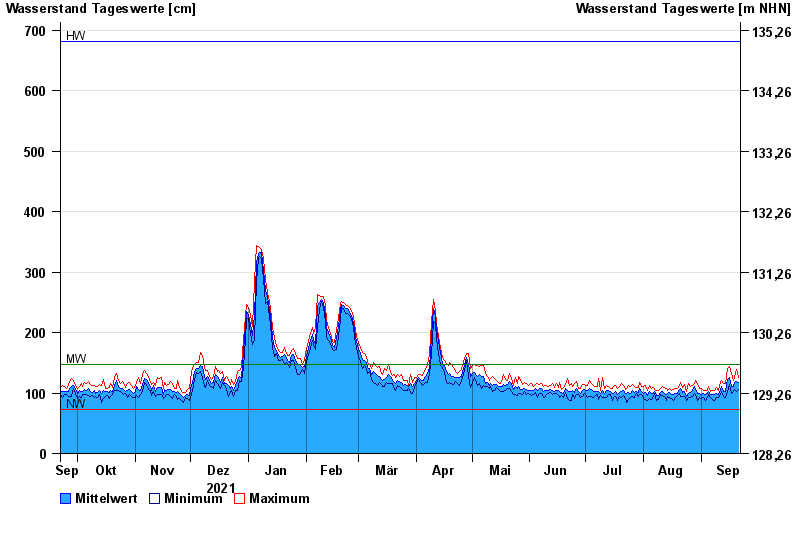
| Datum | Mittelwert [cm] | Maximum [cm] | Minimum [cm] |
|---|---|---|---|
| 21.09.2022 | 117 | 125 | 106 |
| 20.09.2022 | 119 | 139 | 103 |
| 19.09.2022 | 118 | 126 | 106 |
| 18.09.2022 | 110 | 121 | 102 |
| 17.09.2022 | 111 | 132 | 99 |
| 16.09.2022 | 126 | 144 | 114 |
| 15.09.2022 | 123 | 141 | 102 |
© Bayerisches Landesamt für Umwelt 2024