
- Startseite >
- Flüsse >
- Wasserstand >
- Unterer Main >
- Faulbach >
- Jahresgrafik

Jahresgrafik Faulbach / Main
Wasserstand vom 03.12.2021 bis zum 02.12.2022
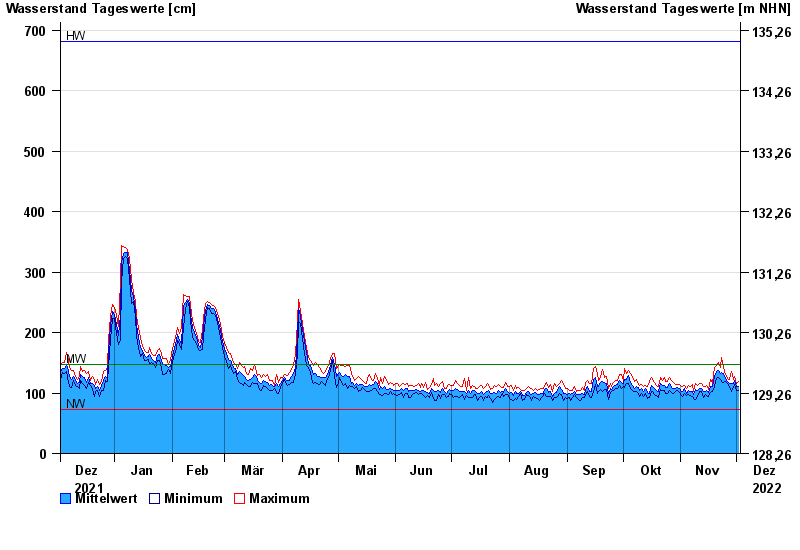
| Datum | Mittelwert [cm] | Maximum [cm] | Minimum [cm] |
|---|---|---|---|
| 02.12.2022 | 110 | 119 | 104 |
| 01.12.2022 | 110 | 115 | 105 |
| 30.11.2022 | 121 | 127 | 114 |
| 29.11.2022 | 115 | 122 | 109 |
| 28.11.2022 | 116 | 135 | 102 |
| 27.11.2022 | 116 | 123 | 111 |
| 26.11.2022 | 119 | 124 | 115 |
© Bayerisches Landesamt für Umwelt 2024