
- Startseite >
- Flüsse >
- Wasserstand >
- Unterer Main >
- Faulbach >
- Jahresgrafik

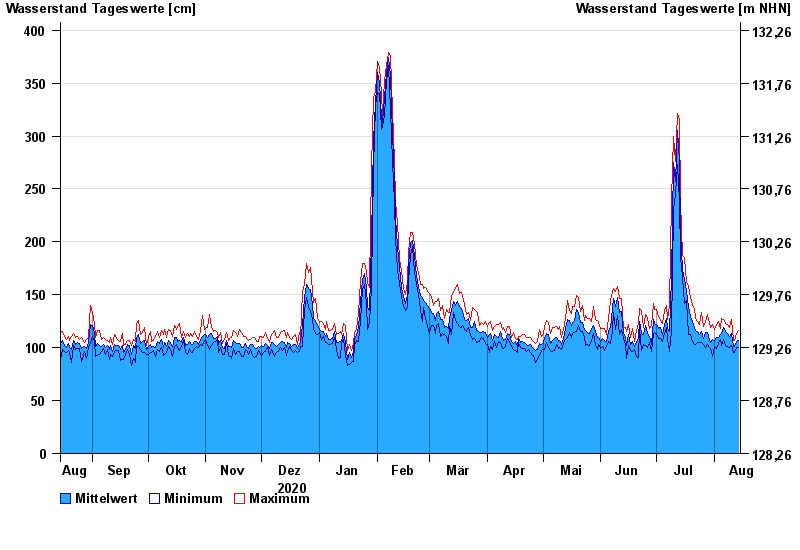
Jahresgrafik Faulbach / Main
Wasserstand vom 15.08.2020 bis zum 14.08.2021
| Datum | Mittelwert [cm] | Maximum [cm] | Minimum [cm] |
|---|---|---|---|
| 14.08.2021 | 107 | 116 | 100 |
| 13.08.2021 | 106 | 113 | 100 |
| 12.08.2021 | 101 | 107 | 95 |
| 11.08.2021 | 101 | 107 | 95 |
| 10.08.2021 | 113 | 127 | 102 |
| 09.08.2021 | 111 | 119 | 100 |
| 08.08.2021 | 113 | 122 | 101 |
© Bayerisches Landesamt für Umwelt 2024