
- Startseite >
- Flüsse >
- Wasserstand >
- Unterer Main >
- Faulbach >
- Jahresgrafik

Jahresgrafik Faulbach / Main
Wasserstand vom 22.09.2022 bis zum 21.09.2023
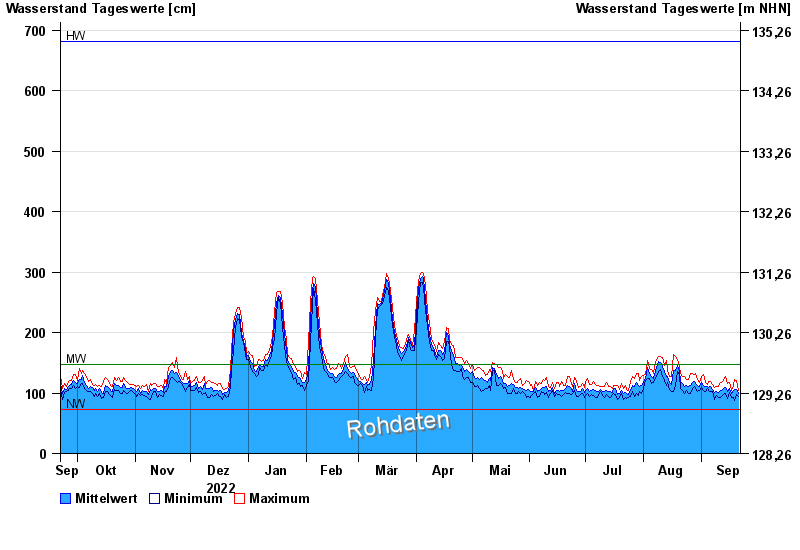
| Datum | Mittelwert [cm] | Maximum [cm] | Minimum [cm] |
|---|---|---|---|
| 21.09.2023 | 99 | 104 | 95 |
| 20.09.2023 | 106 | 121 | 97 |
| 19.09.2023 | 106 | 123 | 88 |
| 18.09.2023 | 105 | 113 | 92 |
| 17.09.2023 | 99 | 105 | 92 |
| 16.09.2023 | 108 | 117 | 101 |
| 15.09.2023 | 103 | 116 | 91 |
© Bayerisches Landesamt für Umwelt 2024