
- Startseite >
- Flüsse >
- Wasserstand >
- Unterer Main >
- Faulbach >
- Jahresgrafik

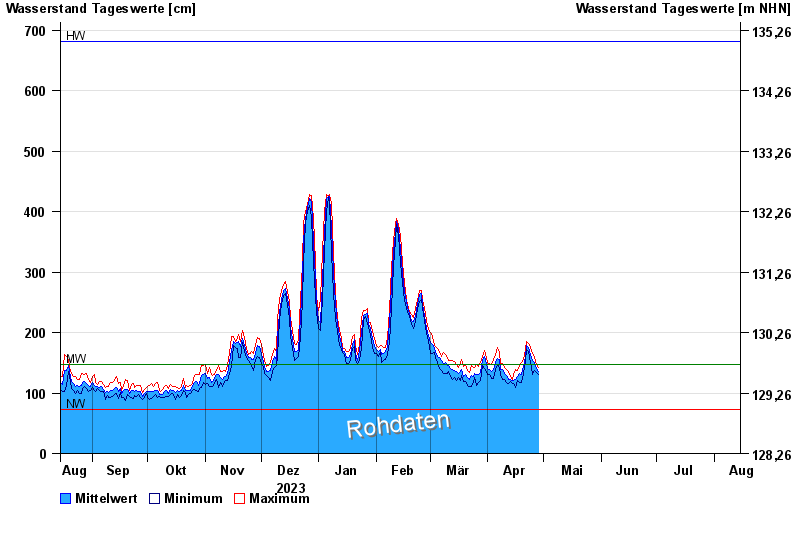
Jahresgrafik Faulbach / Main
Wasserstand vom 15.08.2023 bis zum 14.08.2024
| Datum | Mittelwert [cm] | Maximum [cm] | Minimum [cm] |
|---|---|---|---|
| 27.07.2024 | 116 | 131 | 102 |
| 26.07.2024 | 105 | 118 | 97 |
| 25.07.2024 | 101 | 120 | 90 |
| 24.07.2024 | 111 | 129 | 97 |
| 23.07.2024 | 113 | 129 | 101 |
| 22.07.2024 | 114 | 121 | 108 |
| 21.07.2024 | 108 | 120 | 98 |
© Bayerisches Landesamt für Umwelt 2024